¶ My year in music and yours · 6 January 2025 listen/tech
I think about music in years. 2024 was the first year in a long time that I didn't have anything to do with Spotify Wrapped, but that was never why I thought about music in years, and certainly never how. I like my music data to tell me stories about music not about graphic design, and in verifiable numbers not templated snarkiness. I want to stand at the end of one year and the brink of another and think clearly about how I've been listening, and thus living, and expansively about how I might.
You don't have to want what I want, but if you want to experiment with your Spotify listening data, I've built some tools to help you. To play, you need a computer and a Spotify premium account, and you need to do two things. One is this:
 - go to your Spotify Account page from the popup menu on your profile picture
- scroll down to the evasively named "Account privacy" link and click it
- scroll down the Account privacy page to the "Download your data" section
- check the box on the right under "Extended streaming history", and then the Request Data button at the bottom
While you wait for your data, which will take a couple days, do the other thing, which is to go to Curio, my web thing for collating music-data curiosity, and follow the instructions for getting a free Spotify API key. If you've already done that, just wait impatiently.
When you get your data files from Spotify, go to the History page in Curio and follow the instructions there to load your streaming history. (If the file names in the instructions don't match the files you got, you got the wrong data so go back and request the Extended streaming history like I said.)
You can ask your own questions about your data, but to get started I've already set up a bunch of views that I wanted for myself. Here is a mercilessly geeky tour of those, in which you will learn way more than you ever wanted to know about my year in music.
overview

I listen to music a lot, but never strictly as background, so not for as much time as I could physically. Apparently I went 17 whole days last year without playing any, which I admit is alarming negligence. The count under "tracks" is the strict computer version of counting in which listening to a single and then the exact same song on the album counts as 2 different things. The number under "songs" tries to account for this, although Spotify doesn't give us public access to their internal audio fingerprints, so I just do this by counting unique artist-id/song-title pairs. The "albums" number only counts the albums where I played at least two of their actual tracks (so not separate singles), although it doesn't matter whether they were played from the album page or from playlists. The "artists" number counts only the primary artists of each track. The "genres" number counts only the genres where I listened to stuff by at least 5 different artists. The "of" link at the end tells you that I had 22,423 total streams last year, and you can click your count to see yours, because that's how it should be with data.
tracks
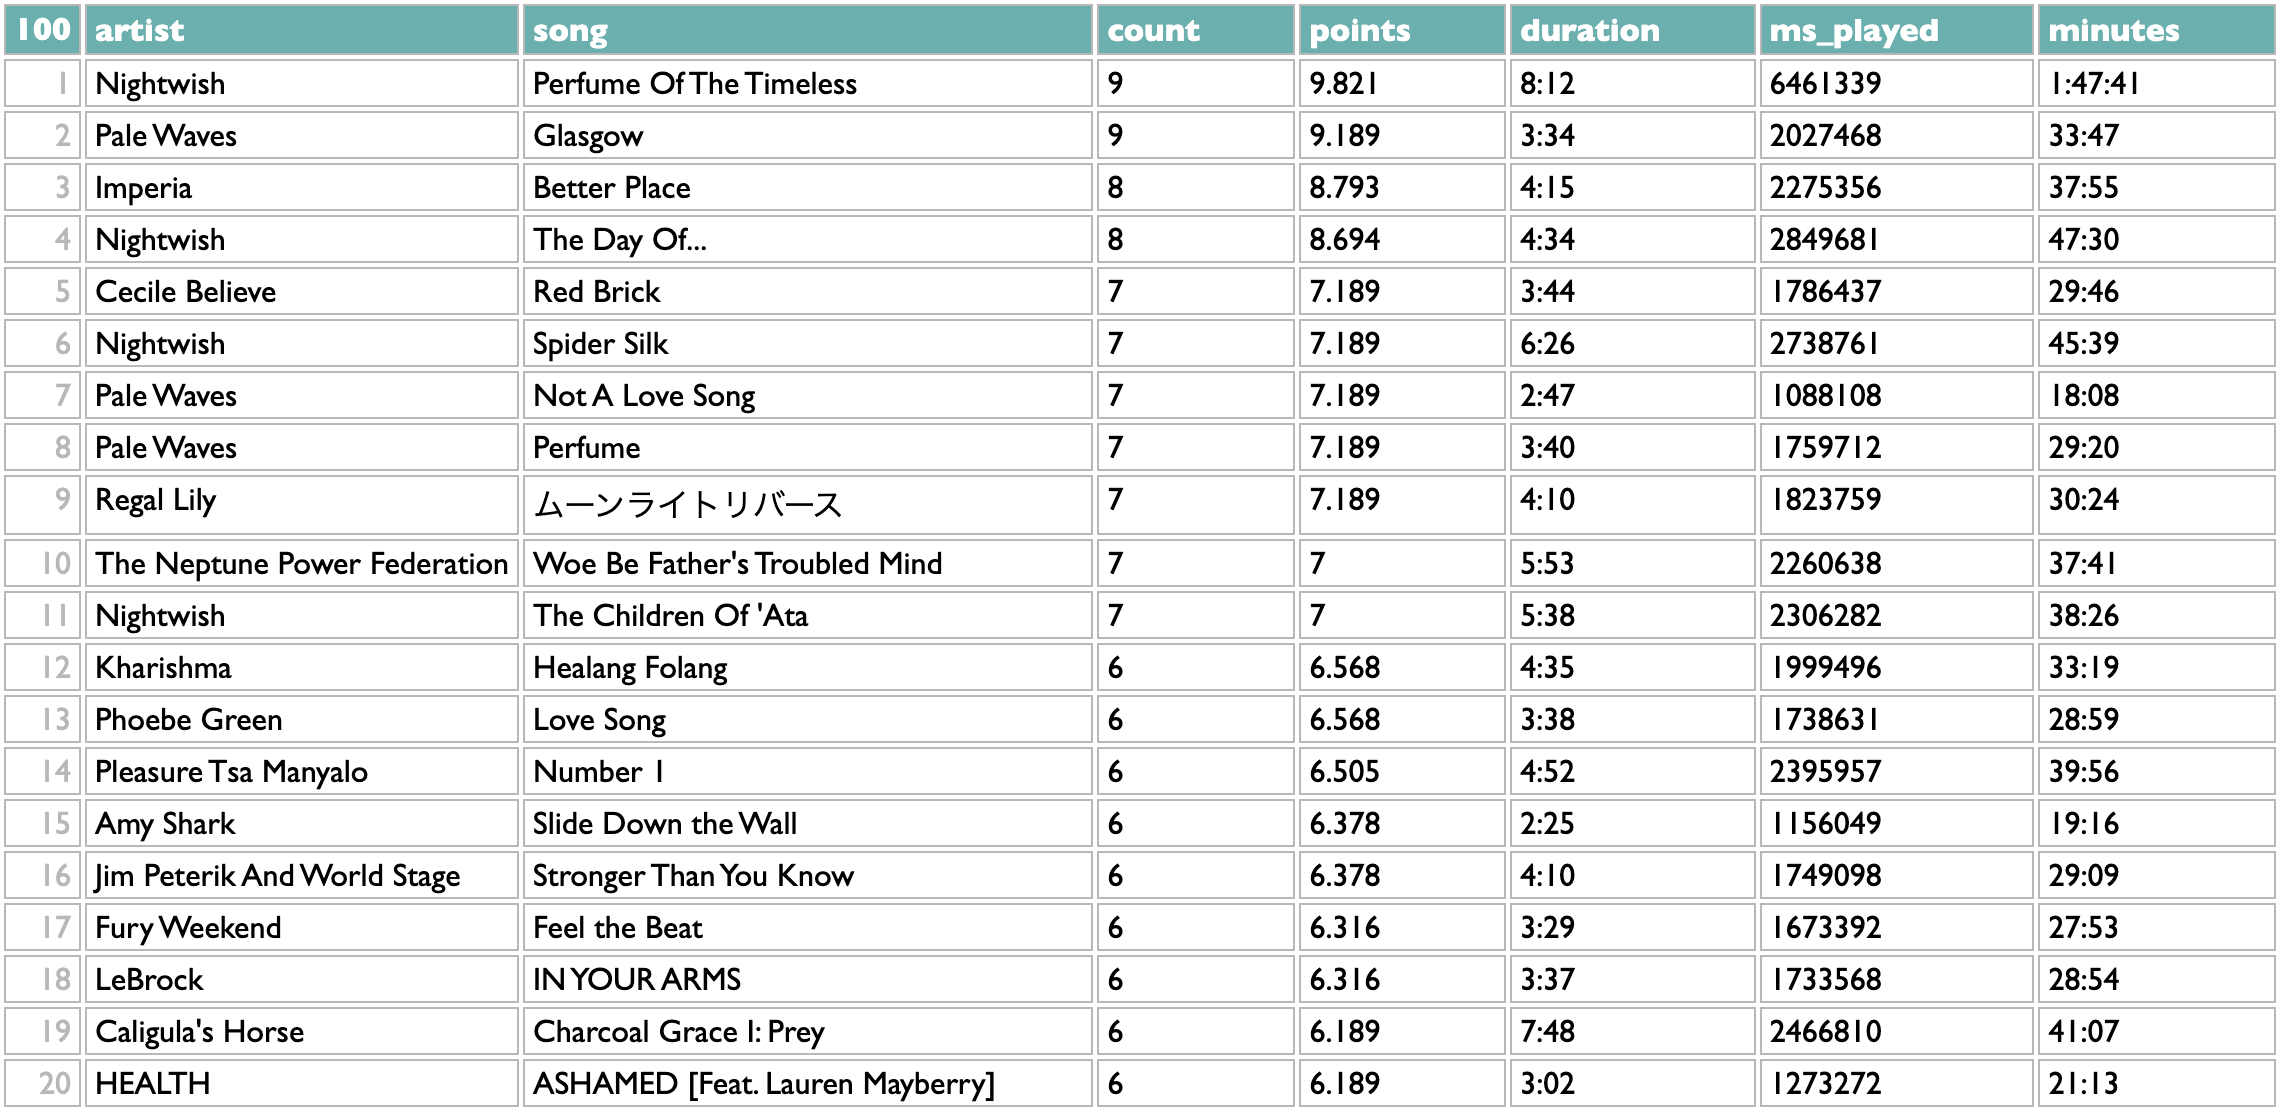
To me a "year in music" is the music that was released in a year. I listen mostly to new music, and all the personal 2024 stats I personally want to see are about my 2024 listening to 2024 music. But there's a "new releases"/"all releases" switcher at the top of most of these History views in Curio, and a separate "old releases" option for a few of them, in case you feel differently. The ranking of tracks is done with a points calculation that you can see for yourself by going to the "see the query for this" link below the table, but my philosophical position is that playing a song on loop for a while is better evidence of affection than playing it once, but not better evidence than returning to it deliberately over the course of different days, so I give each song the sum of 4th roots of its daily playcounts. (Why 4th roots? Square roots didn't mute the looping effect enough for my taste, and chaining two square-roots together worked enough better than I didn't bother adding a cube-root fucntion to the query-language yet. (Although there's also a way to do arbitrary math, so you could raise it to the power of a third, but let's not.)) I don't tend to repeat individual songs very much, so this view isn't my favorite way to look at my own history, but even so it's useful for cross-checking the playlist view that we'll get to at the end.
albums
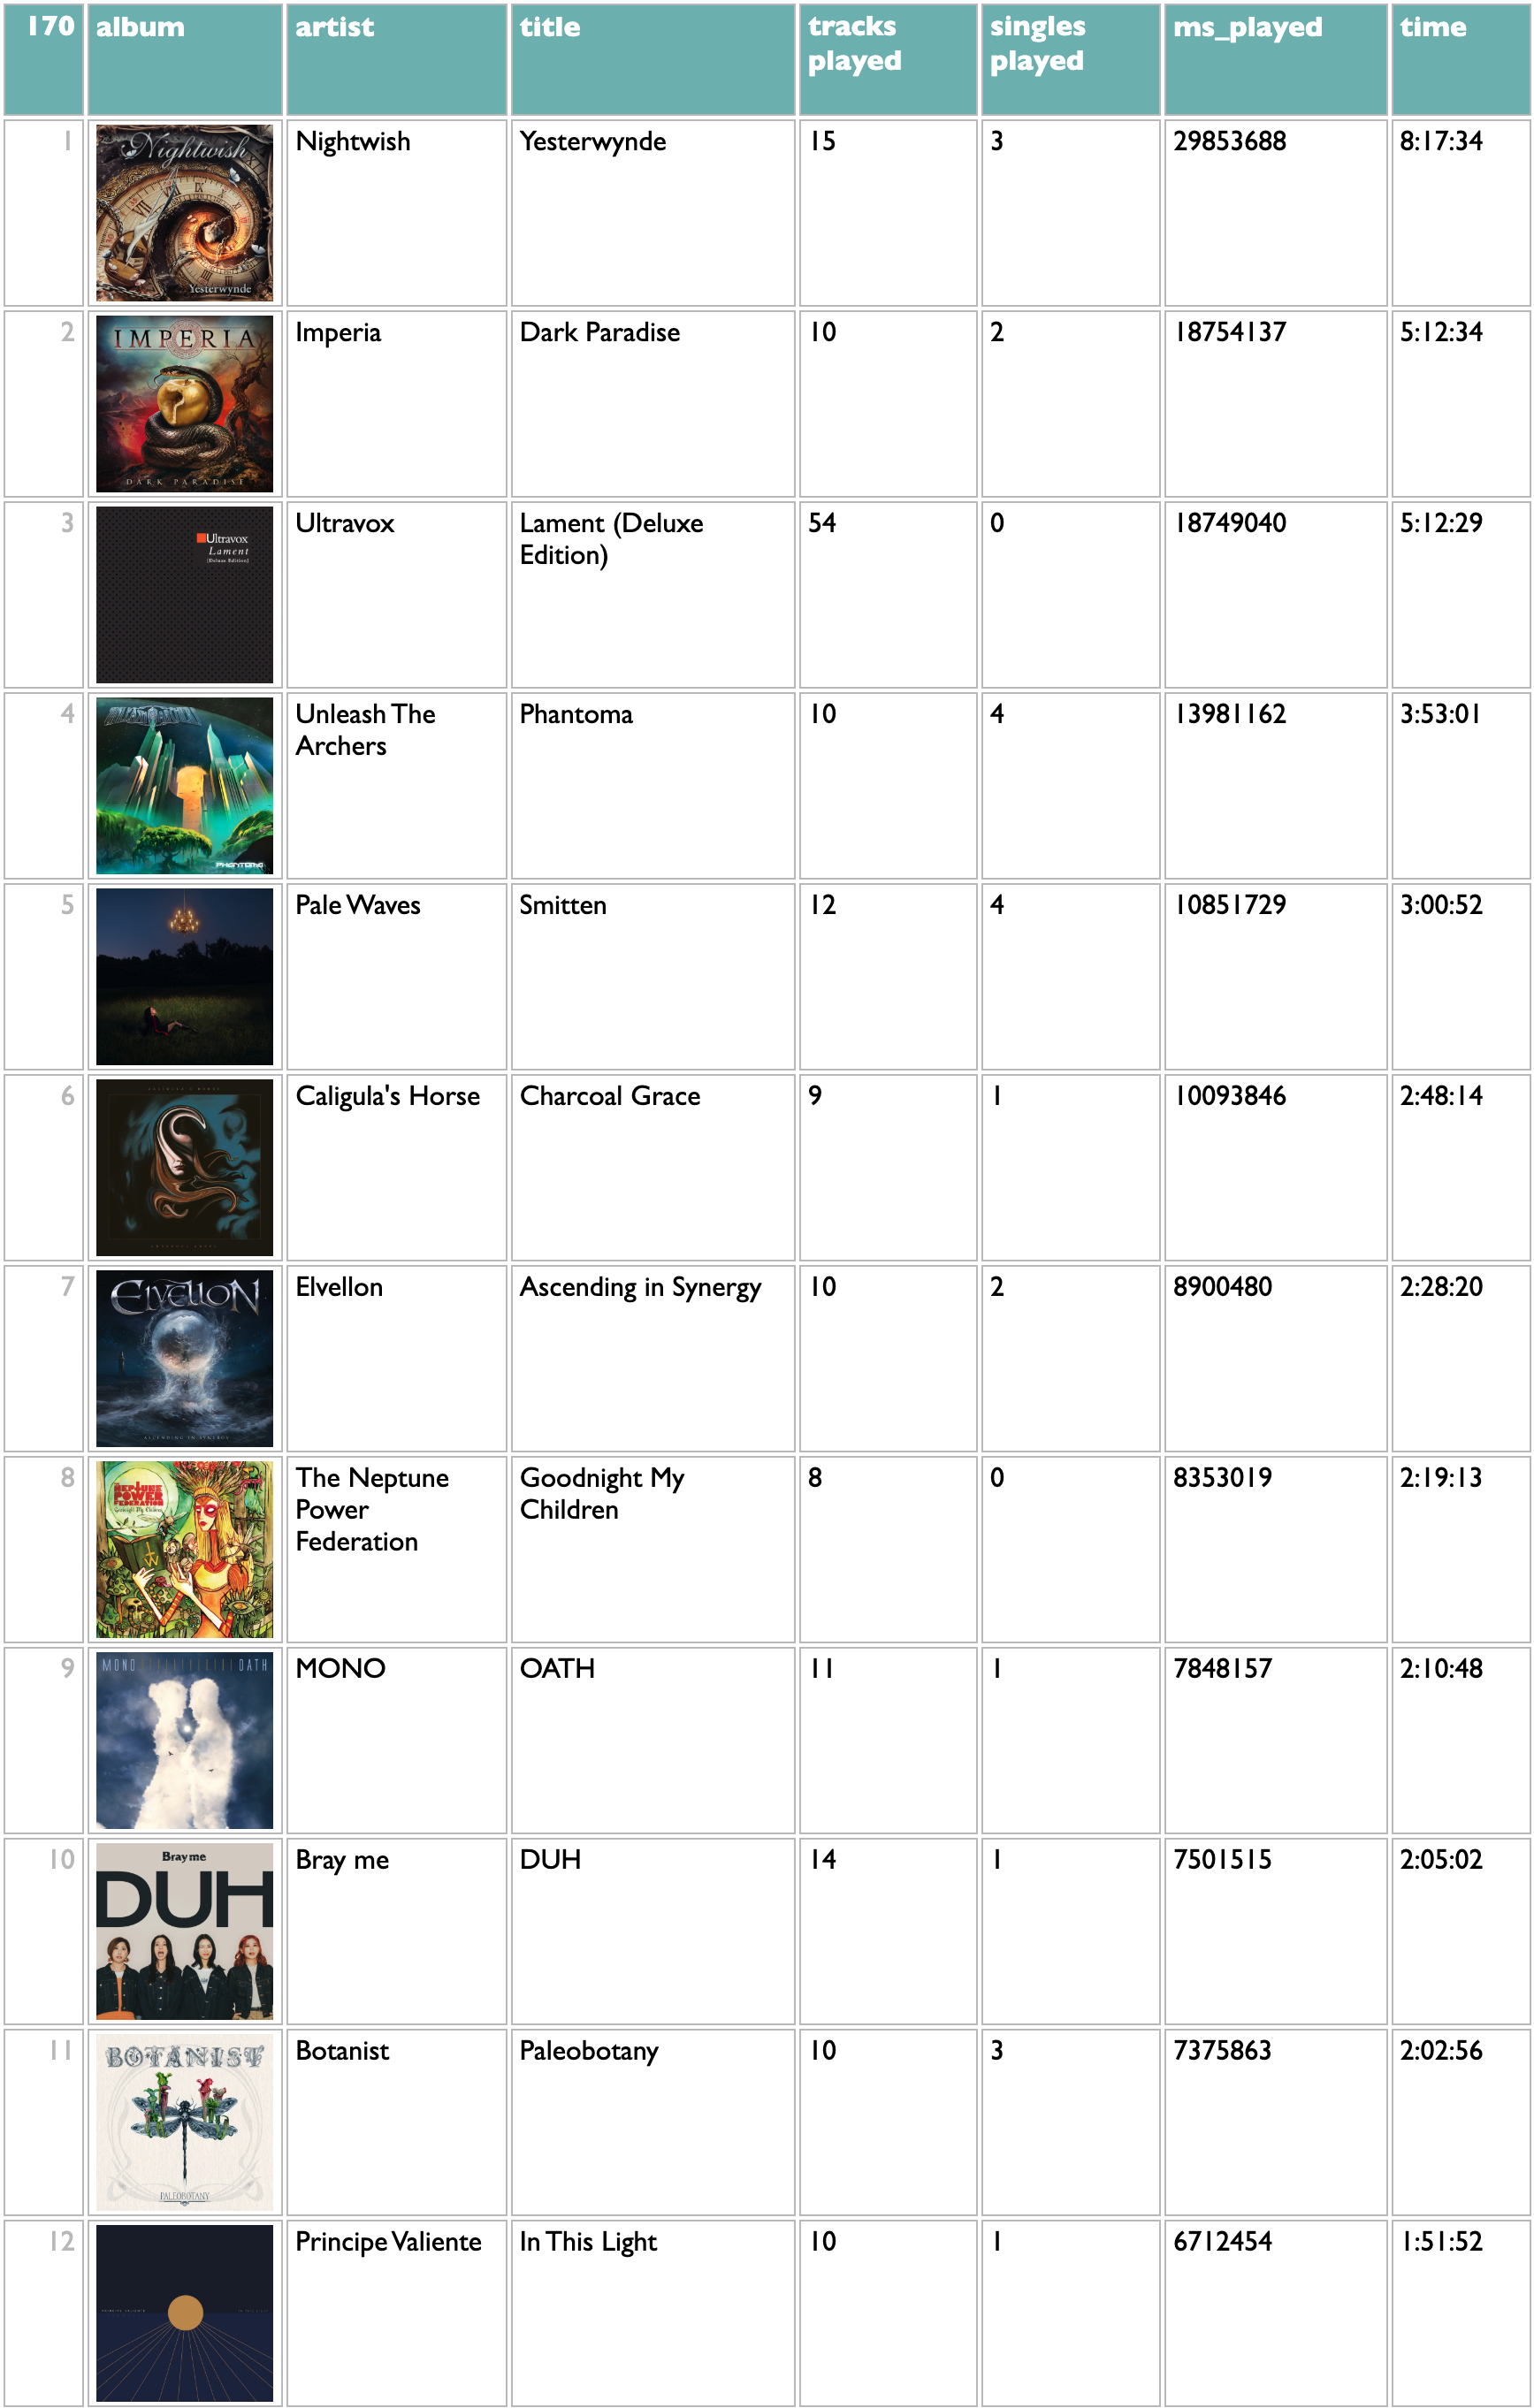
I mostly listen via weekly playlists of new releases, usually with only one track per artist, and in the increasingly common case of waterfall releases where most of the tracks on an album are released individually before the whole album, it's common that I have listened to most of the contents of an album without directly playing the album much or at all. All of these, though, are cases where I cared enough to break my playlist pattern and play these whole albums. "ms_played" means milliseconds, and is the standard Spotify measurement of how much clock time you spent listening to a song independent of its duration, so if you end up doing your own queries you'll quickly get familiar with this. The query here does some fun stuff with song titles and release types to try to report the album/single dynamics of my listening, but it won't surprise me much if your listening has some edge cases I didn't catch in mine.
artists
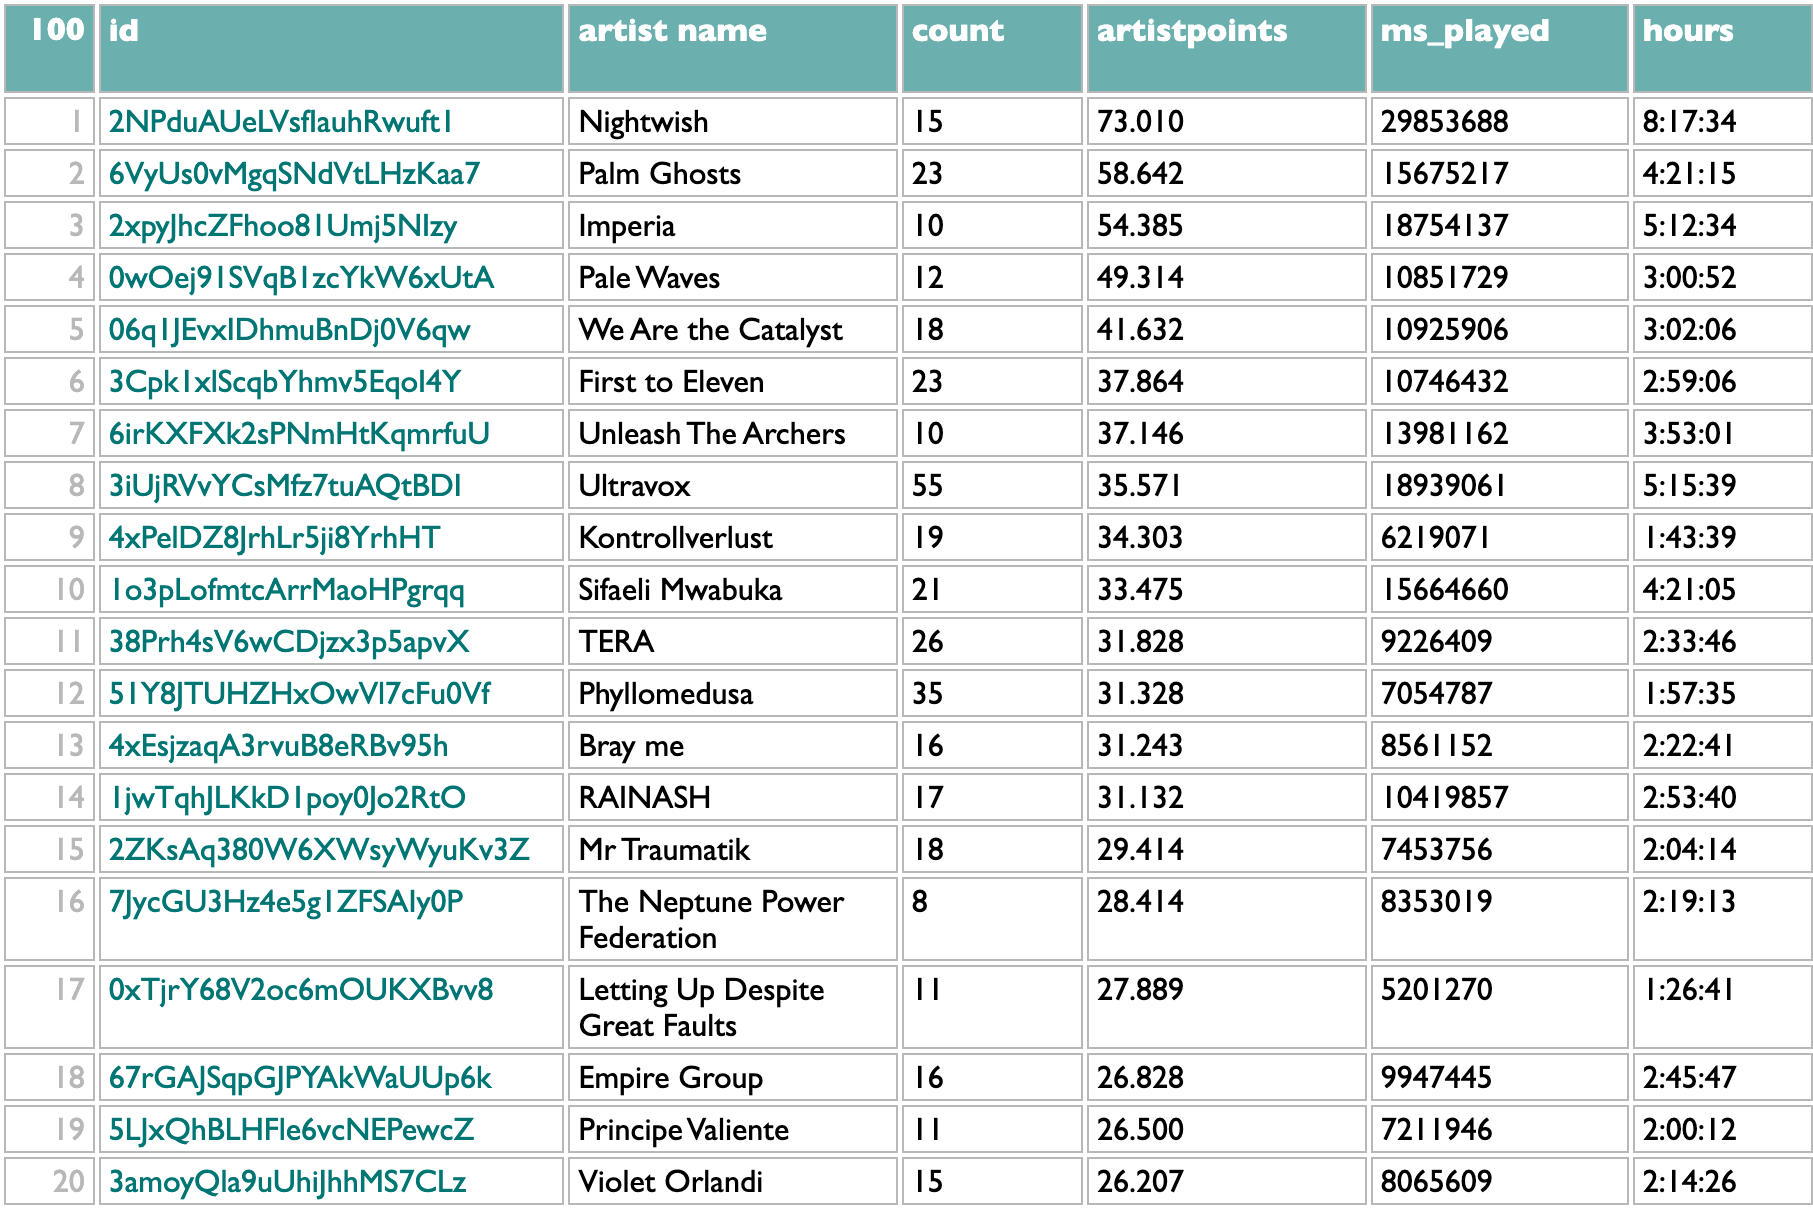
But really, my levels of attachment to music are, and have been for years, mostly artist and genre. Humans, individually and collectively. The track and album lists are, for me, steps on the way to this artist list. At the artist level, too, I am leery of overweighting isolated looping, so my artist point system sums up the square roots of the number of unique tracks by that artist played on each listening day. The "count" column here is the total number of unique new 2024 songs I played by each artist. This list is a pretty good telling of my 2024 music story to myself. I expect the chance is low that anybody other than me knows this specific combination of specific artists well enough to make sense of it. First to Eleven is a prolific pop-punk covers band who put out new songs every week or two. TERA is a strange home-demo-sounding vocaloid project that has survived me mostly rotating out of vocaloid music because their use of artificial voices is so artificial. Phyllomedusa is frog-themed grindcore. Sifaeli Mwabuka is a Swahili gospel singer from Tanzania, and I could not have told you his name and am probably as surprised as you that I spent more than four hours listening to him, but apparently he is what happens when you try to listen to both maskandi and Sepedi wedding music despite not really knowing much about either. But mainly what this tells you, as you already knew if you read my book or ever talked to me about music for longer than five minutes, is that I love Nightwish and they had a new album this year.
popularity
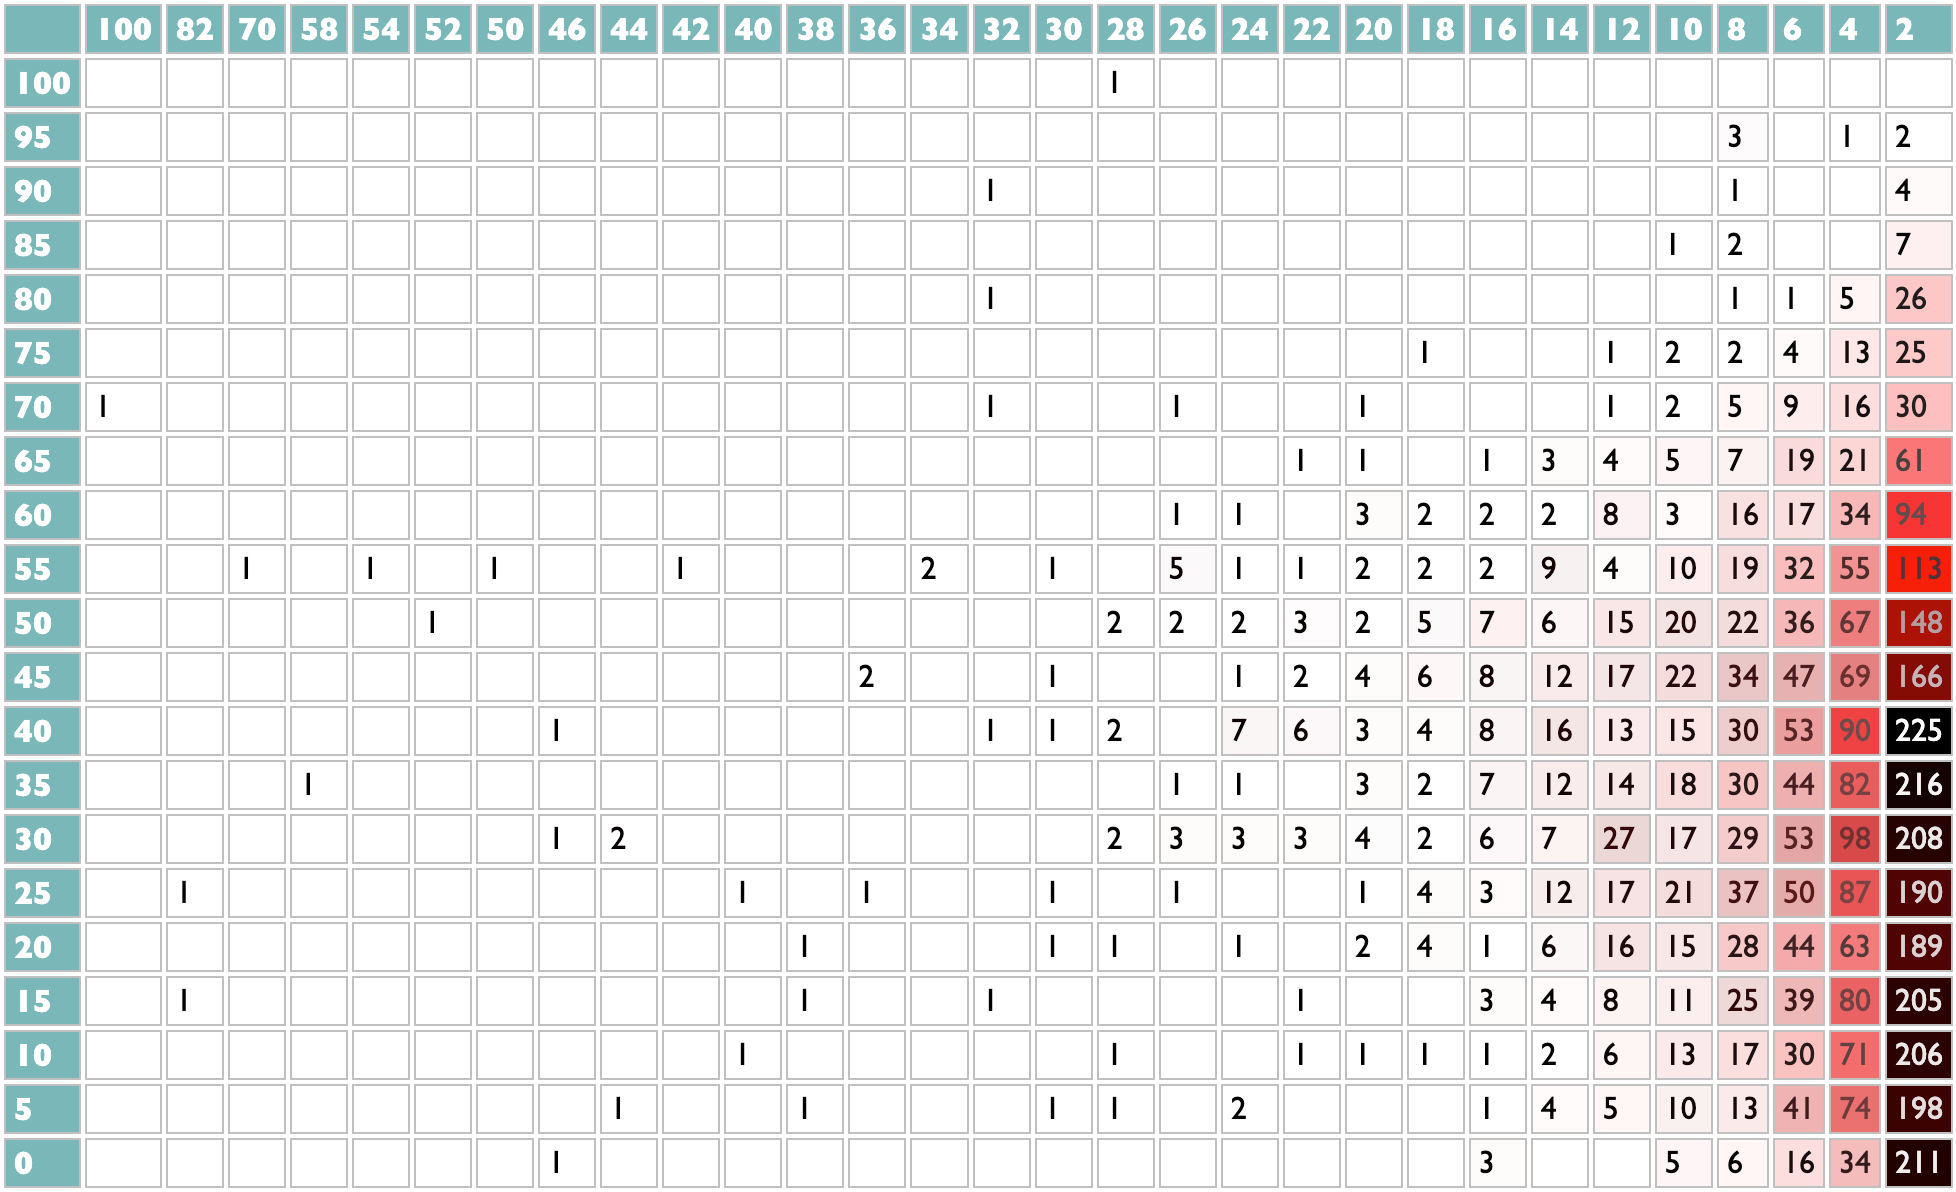
My favorite one-time thing I ever did for Spotify Wrapped was the Listening Personality, in 2022. It wasn't supposed to be a one-time virality-nudge, it was supposed to be the seed of a way for humans and algorithms to talk to each other about the aspects of music-preference that are independent of what kind of music you like. Spotify, sadly, was not as interested as I was in what people actually want, nor about using algorithms to amplify curiosity instead of, say, maximizing marginal revenue, so I never got to do more with the Listening Personality codes beyond showing them to people once, but at least I obstinately insisted on Wrapped displaying the four-letter Myers-Briggs-esque codes I devised for each listener, over the graphics team's predictable attempt to reduce the 16 combinations to unexplained tarot cards. (But don't worry, they got their tarot cards the next year.)
I can't exactly reproduce the Listening Personality with just our own listening histories, because the calibration of the polarities of each axis was done holistically across the whole Spotify population. But if we lose collective breadth, we gain individual depth. Instead of a single letter-pair encoding a single score representing how popular the music you tend to listen to tends to be, here we have a heatmap in which the X-axis is your level of artist attachment (scaled to 100 for your most-played artist) and the Y-axis is those artists' global popularities (scaled to 100 for Taylor). What my heatmap tells us is that I listen very broadly to a lot of artists who are not very popular but usually are also not entirely unknown. And I also do like Taylor. If you only listen to Taylor, your heatmap will be a single red cell in the top left with a number of which I assume you will be very proud.
diversity
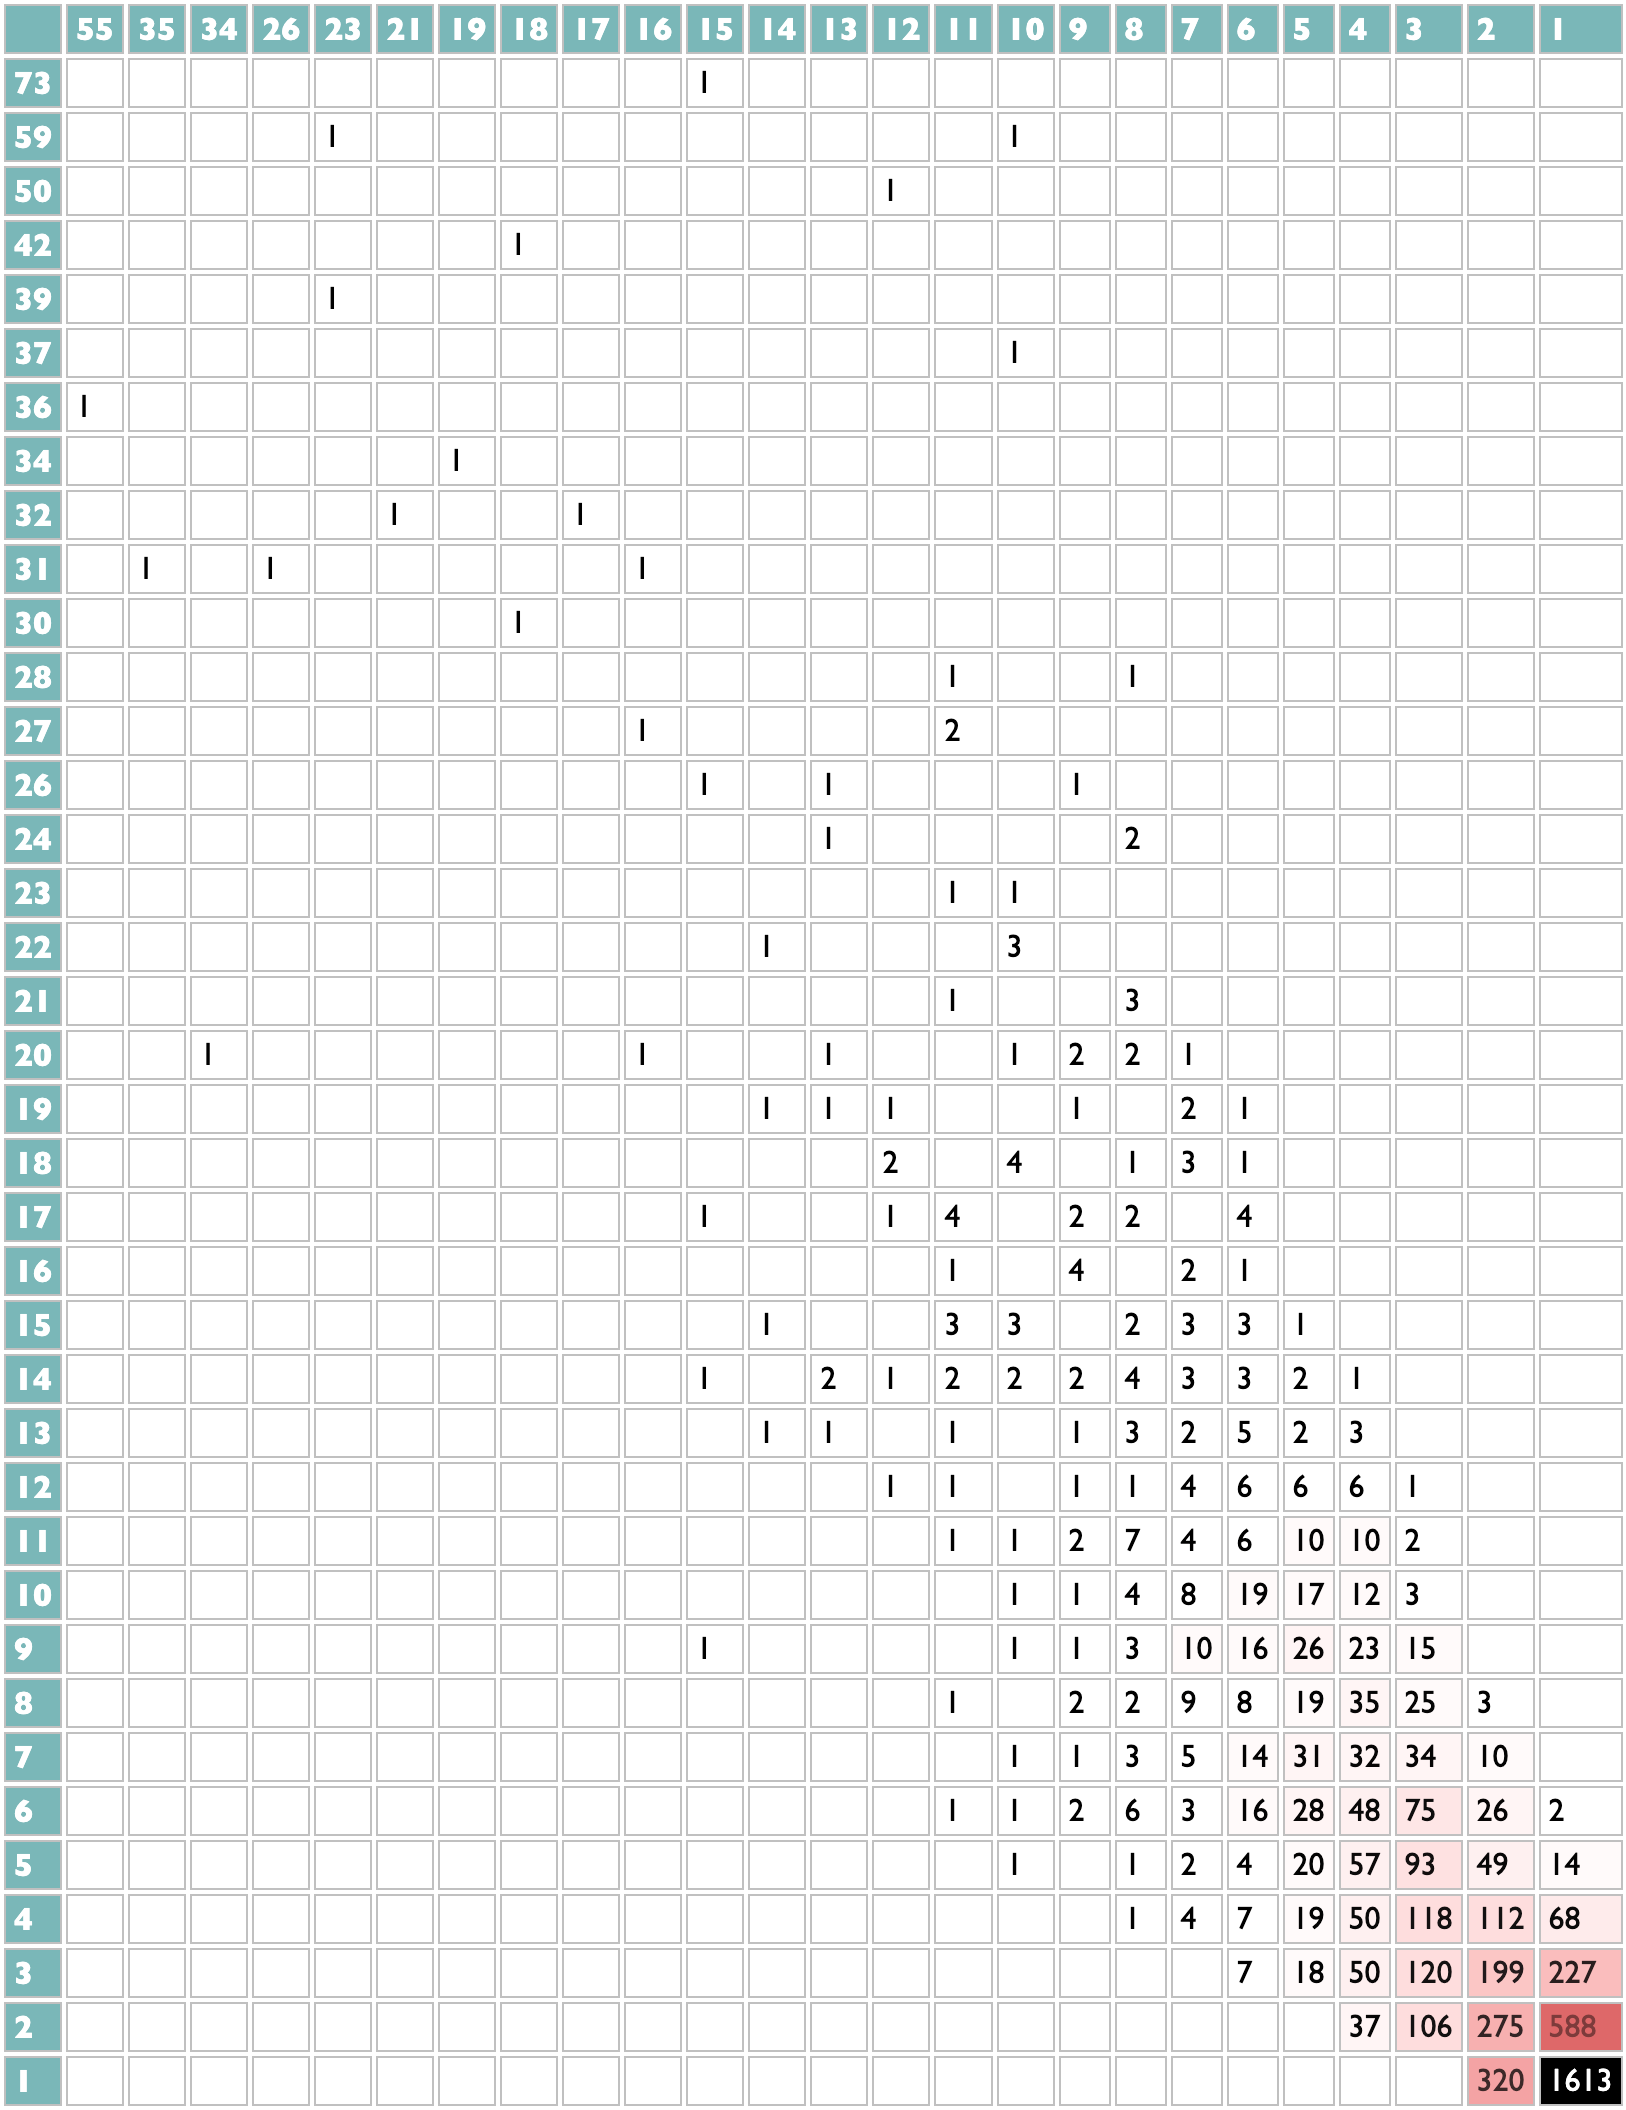
Two of the other three dimensions of the Listening Personality had to do with how your listening is distributed or concentrated across artists and across songs. I am a fairly extreme outlier in the direction of variety in both, which we see here as a small explosion centered in the bottom (more artists) right (more songs). If you spent the year cycling through Taylor's Versions of everything, you would end up in the top left; if just covers of "Anti-Hero", a red line down the right edge. The axes here are not normalized, because I no longer have access to everybody else's data to figure out a generalized granularity, so your own version of this view may be comically small or awkwardly large.
genres
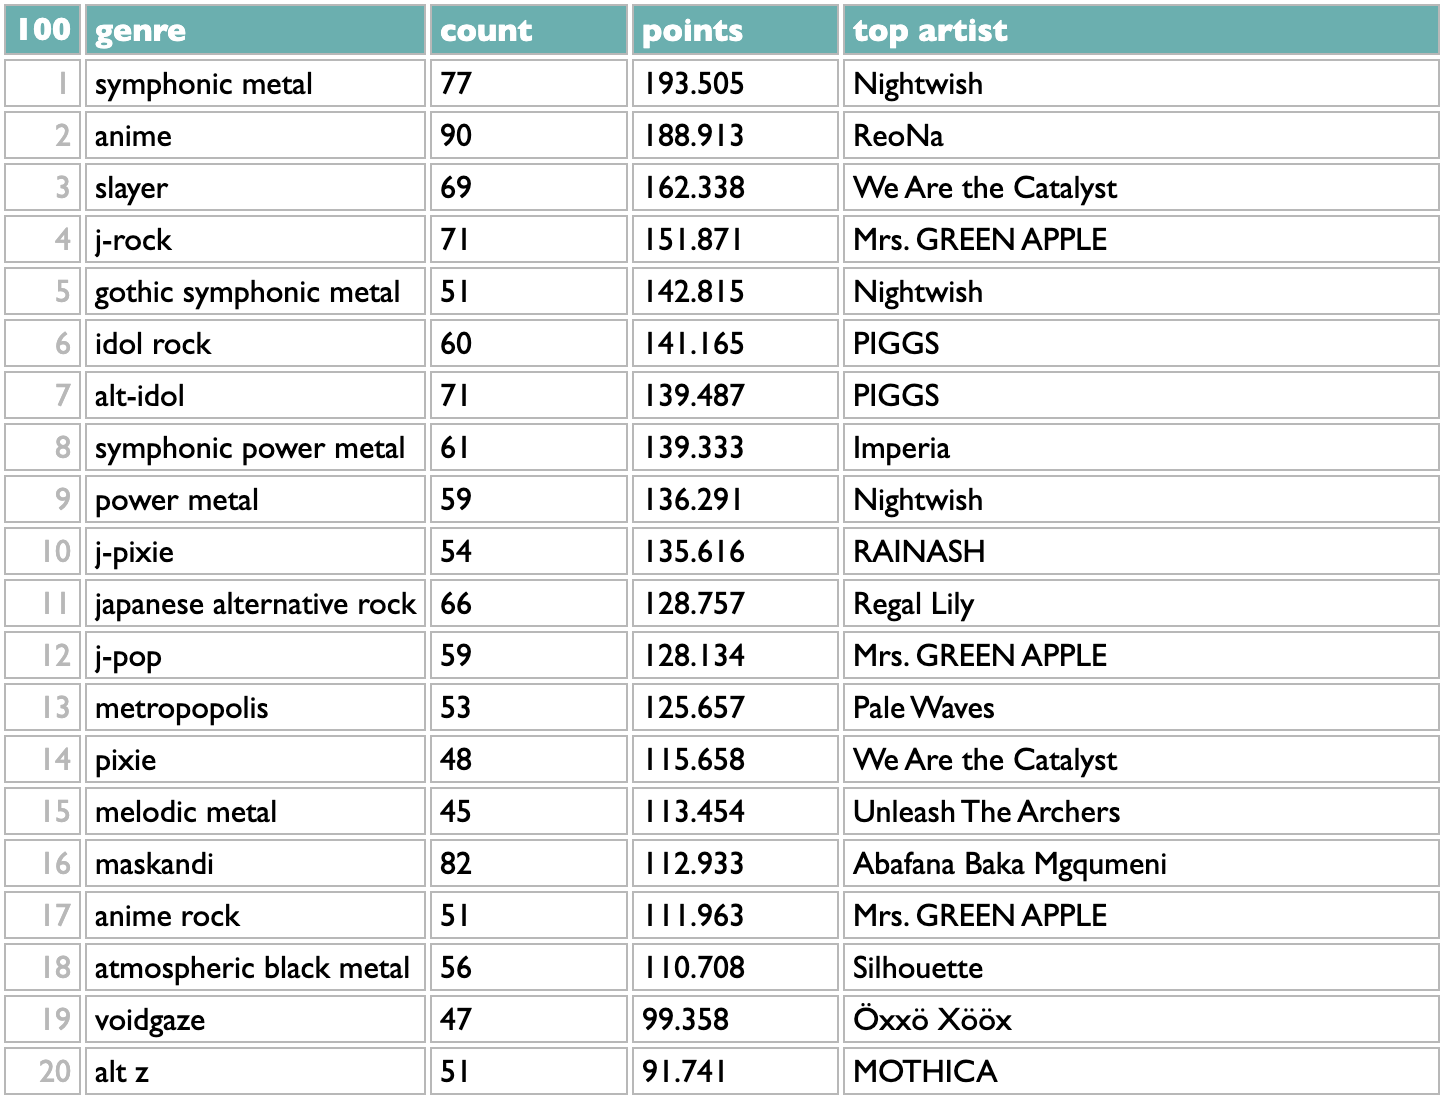
The Wrapped story I worked on every year (although one year they substituted something else without having the guts to tell me they were going to) was the list of your Top Genres. I have taken some shit over the years for occasionally making up genre names, but if you want to know what the point of that was, there's a whole chapter about it in my book, and after seeing the 2024 Wrapped in which Spotify ditched the whole concept of genres as human musical community and generated idiotic random phrases instead, I feel 100% comfortable with what I did. Every year as we started making plans for Wrapped I said the same three things: 1) I will do the genre analysis so it's right, because these are real communities of artists and listeners in the real world and they deserve to see themselves. 2) Let's show people all their genres instead of just five. 3) And let's also let people see which artists (both in general and that you like) go with each genre, so the whole thing isn't mysterious. And every year the "creative" team said something like "Or what if we show the same unexplained list of five, but as a spinning hamburger made of radioactive sludge?"
Curio's version is obdurately sparkleless but sludgeless: all your genres, ranked with artisanally hand-tuned scoring, and clickable in your version to see exactly which of your artists make up each list.
words

My favorite story I proposed for Wrapped, knowing full-well that it would never get approved, ironically did involve generating random phrases for people, but the way I did it was from the words in the titles of the songs you played, so even this totally frivolous thing was explainable and there was a sense in which it could be correct. The key to getting a short list of pertinent words is having the whole population's listening to work with, so you can give each person the few words that most distinctively characterize their listening. Without that global data I am forced to give you lots of words instead of a few, in a weighted shuffle to avoid everybody's saying love death soundtrack day, but hopefully yours, like mine, will including something true and vulgar that will make you smile and would make lawyers panic.
durations
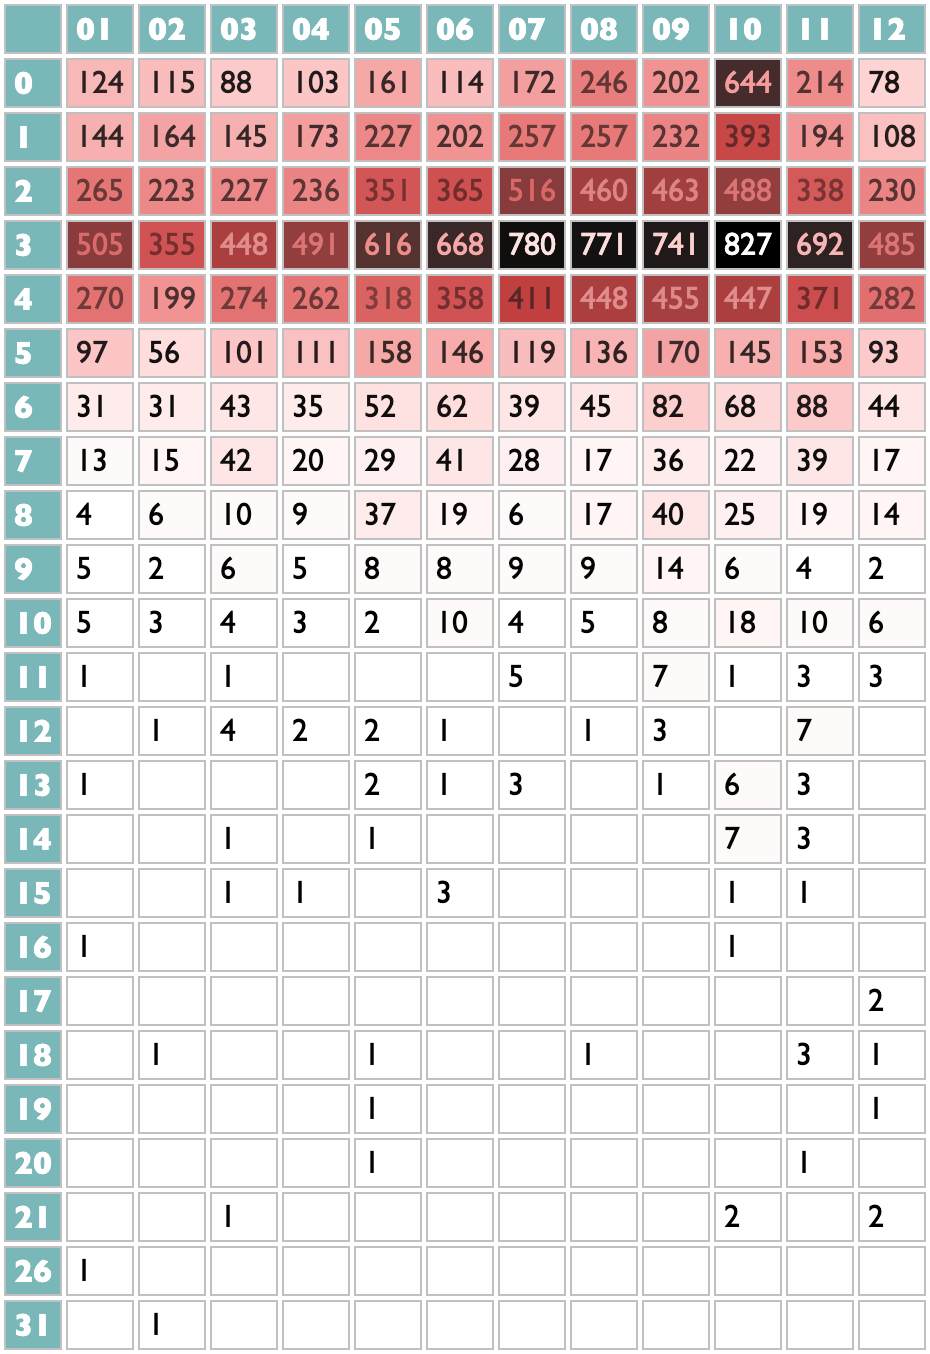
People talk about pop songs and attention spans both getting shorter, and we have all those milliseconds, so this one is a view of your listening (by month, for fun, across the top) distributed by how long you listened to each track (in minutes, down the left). I listen to a lot of three-minute songs. I listen to a few seconds of a lot of songs and then skip. I listen to some long songs. Apparently in October I was working on getting the track-scan timings right in Curio.
daymap
Everything you play on a streaming service is timestamped. In Spotify's case the timestamps are in UTC, so I included a timeshift option to allow you to bump them into your local time, or adjust your listening day some other way if you prefer. I'm not going to include my daymap, here, because it shows you every timestamp from the entire year and I realize looking at it that immediately reveals exactly when I traveled to a different time zone this year, and maybe that's more sharing than I need.
weekmap

Musically speaking, though, the view by hour and weekday is more relevant. Spotify spent a lot of energy, over the years, trying to believe that most people's listening is heavily determined by day and time, and if yours is, now you have a playlist feature for that in Spotify. Mine isn't. I make a playlist of new songs I want to hear every Friday, and then I cycle through it, gradually deleting songs I don't end up enjoying, for the rest of the week. Thus there is absolutely no sense in which a have different music I prefer on Tuesday afternoon vs Thursday morning. What I do have, as you see here, is a very distinct pattern of doing a lot of rapid new-song scanning while eating my lunch on Fridays. Also, hopefully I do not have any important online accounts for which the security question is "At what hour are you most likely to be asleep?"
release years
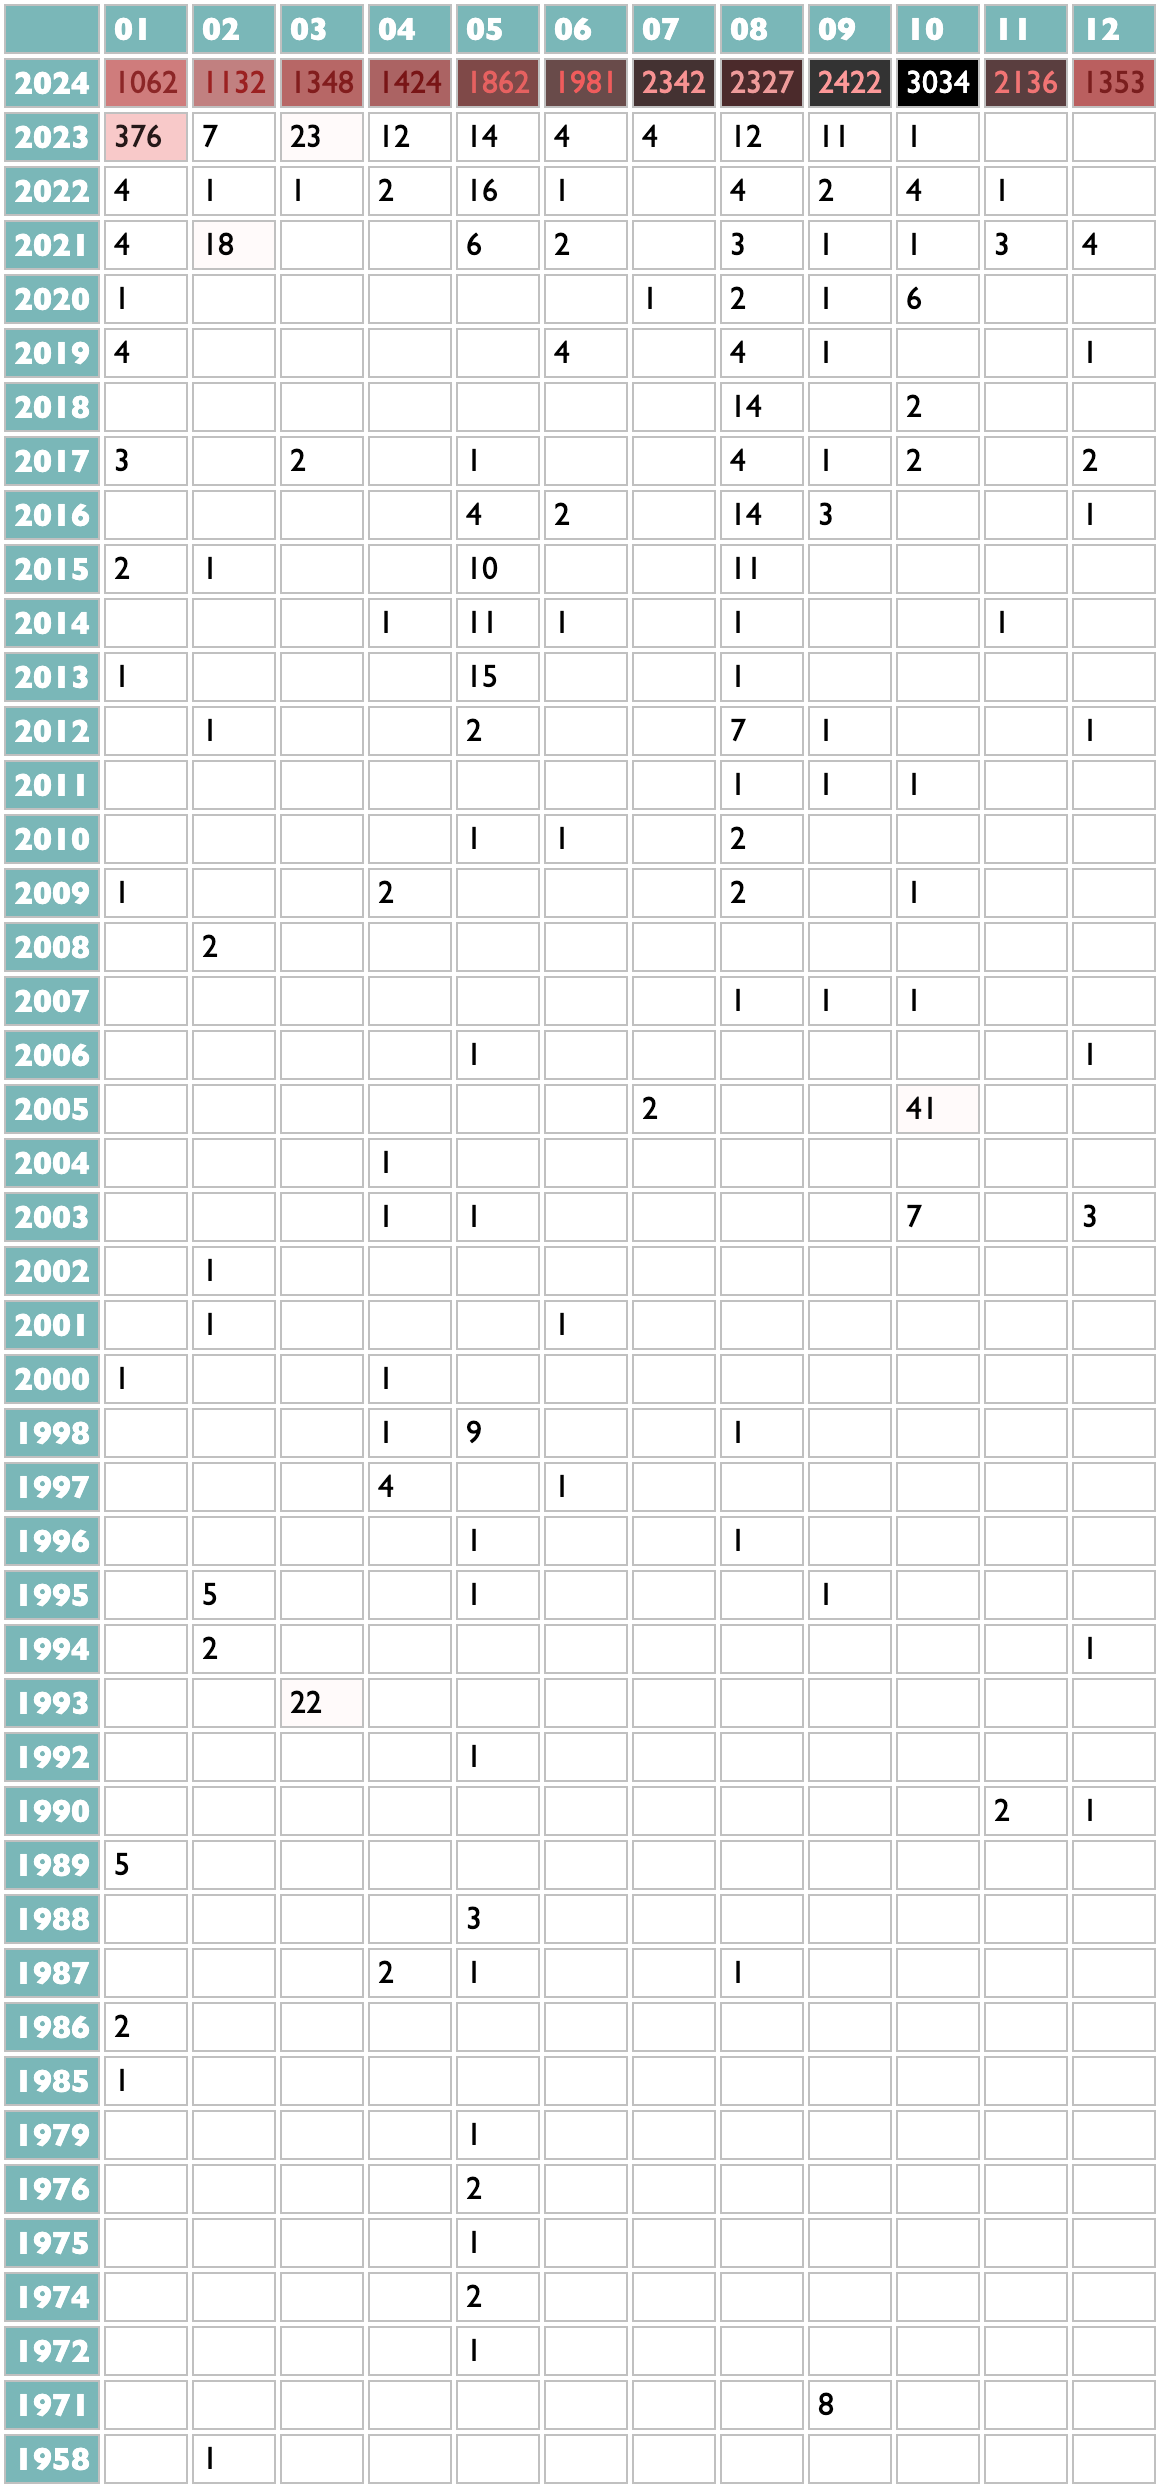
The fourth dimension in the Listening Personality was newness. I know, from data, that I am, or at least for a few years provably was, one of the handful of people in the world whose listening is most intently focused on new music. Curio thus has two different ways of looking at this particular quirk. This first one shows release years by listening months, so you can see how I listen to songs from the previous year for at least the first week of January, and how in May last year I tried and ultimately failed to find or remember one particular Ray Charles song.
song ages

My listening pattern is even clearer in this view by song age, with ascending resolution. Friday is new-release day, but I am often distracted from listening over the weekends, so Monday through Thursday I am most heavily playing the songs from the previous Friday.
poster
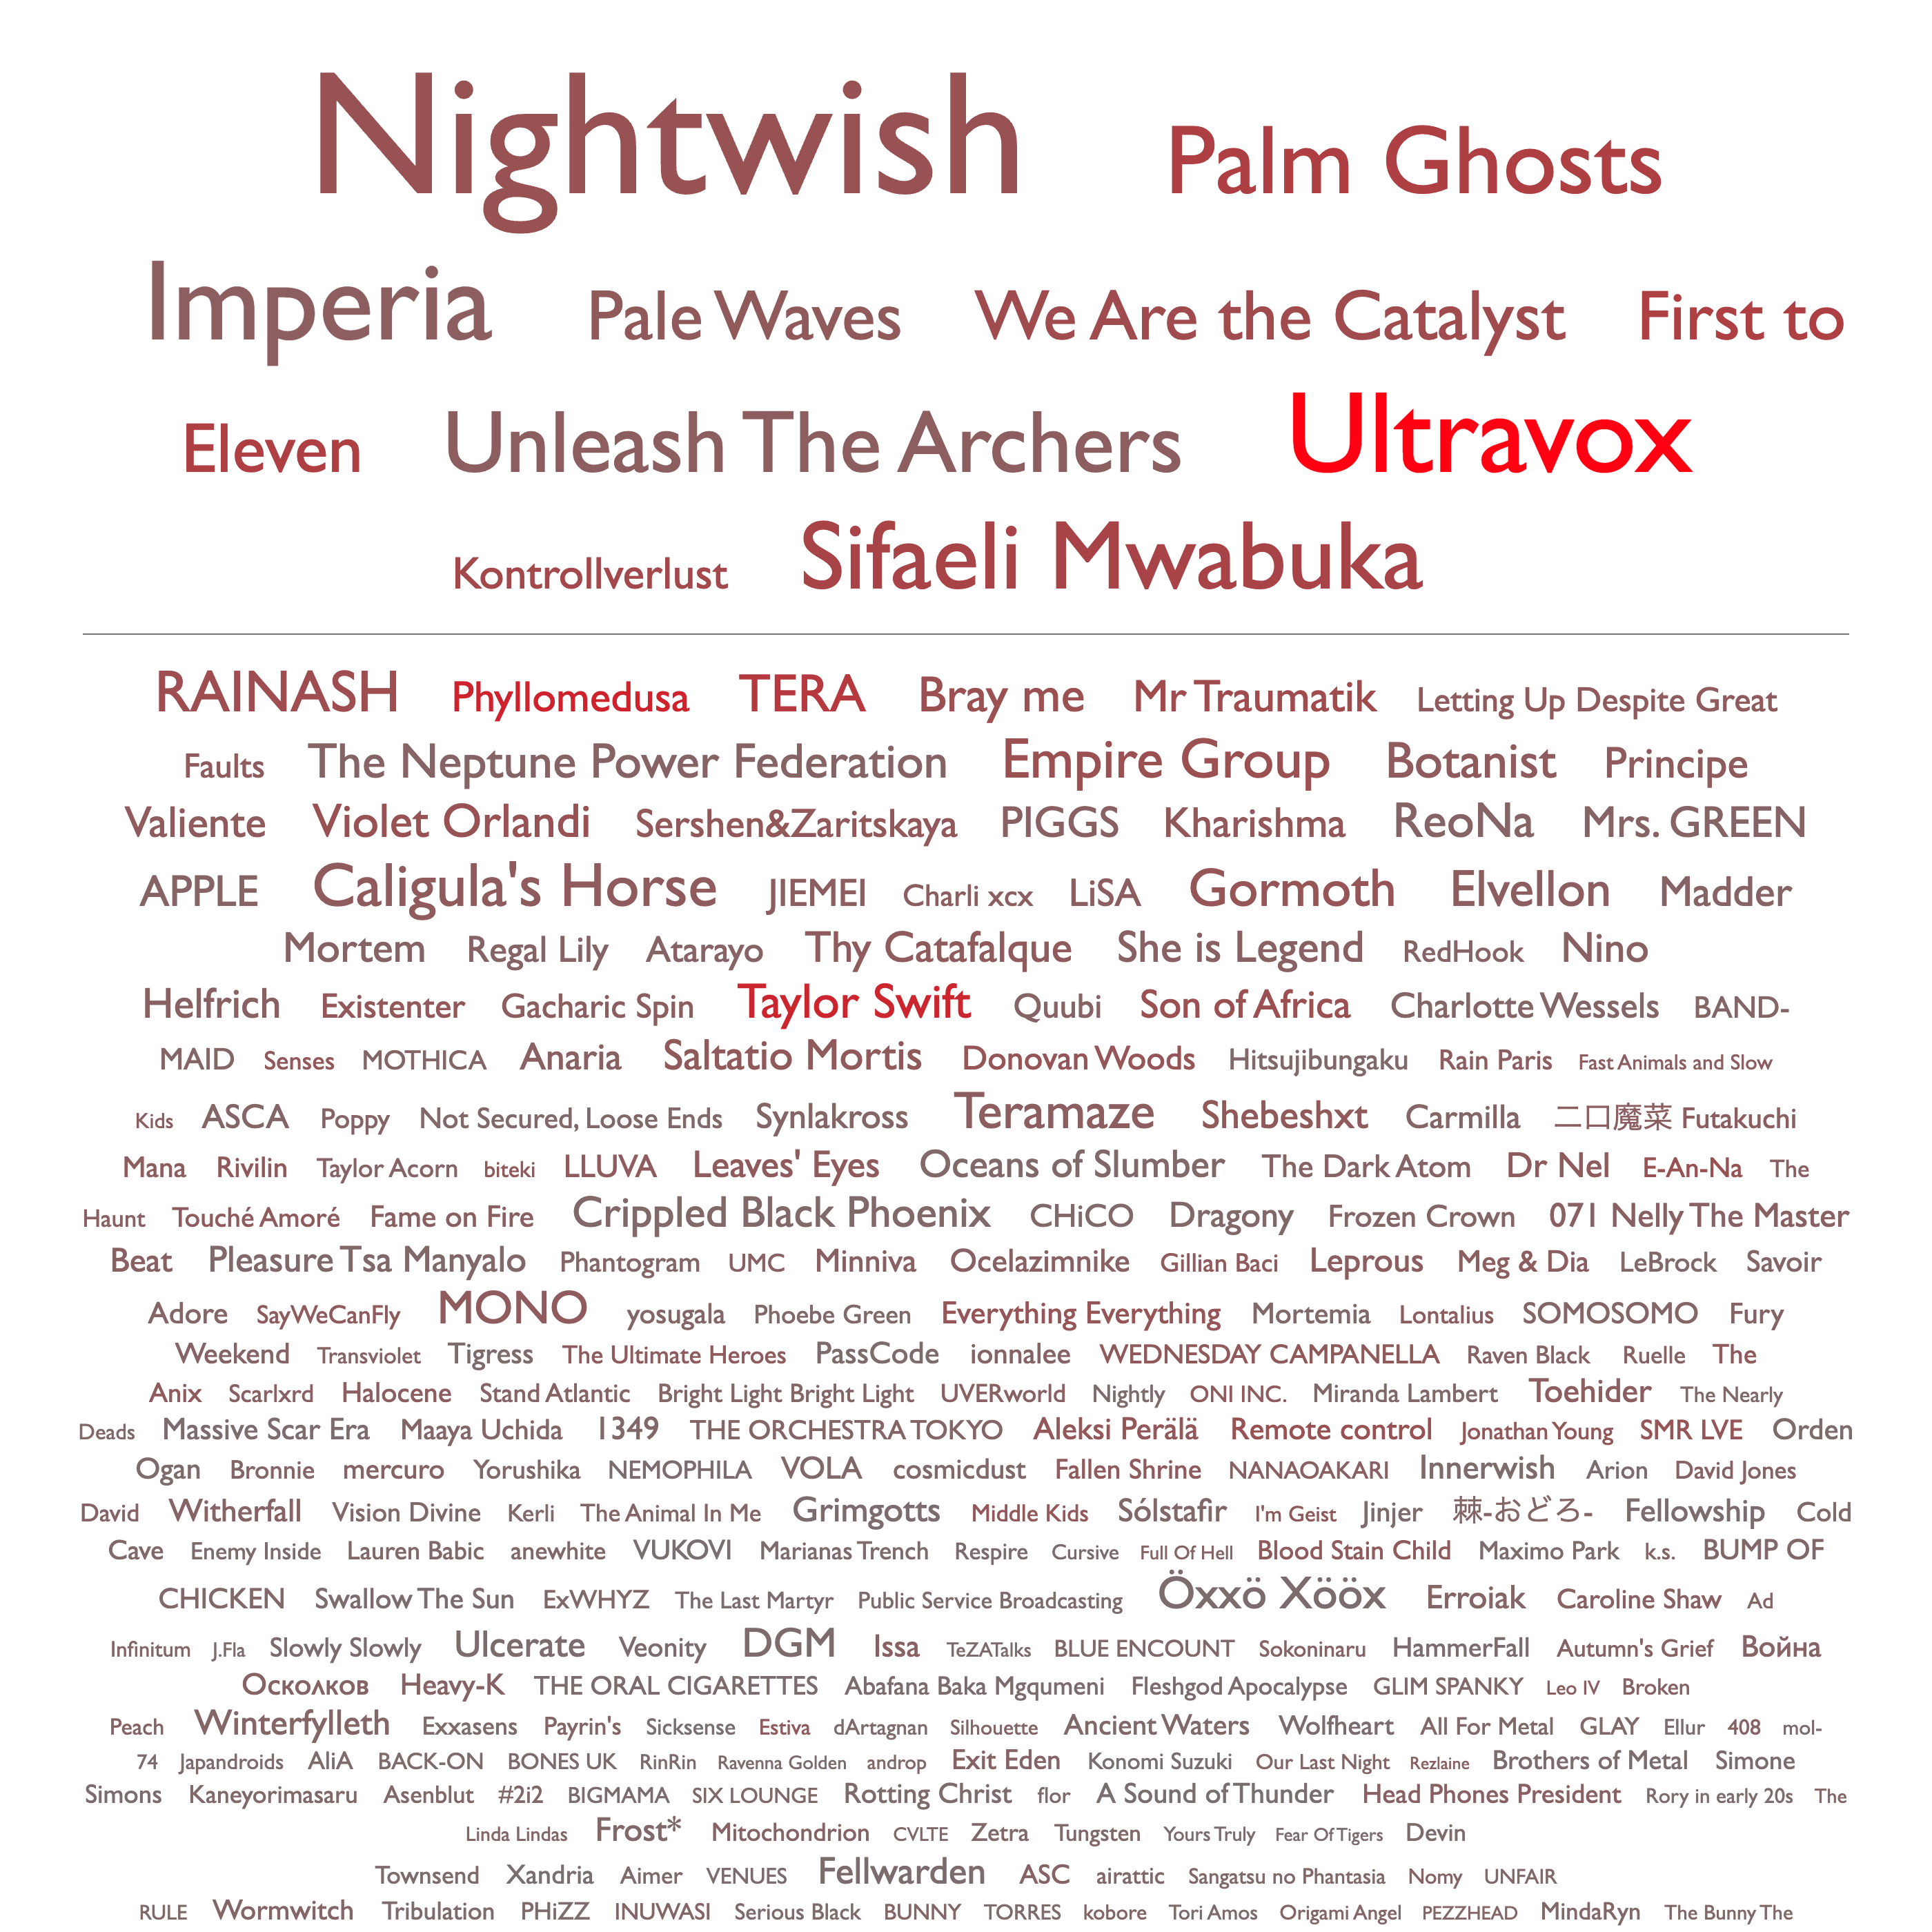
As you may already realize, my taste in visual design runs to the Tuftean. Don't make me justify the horizonal rule in this poster view to ET, but the order and sizes and colors here are all data-driven, and yet it's still faintly reminiscent of a concert-poster design.
10x10 grid
5x5 grid
banner

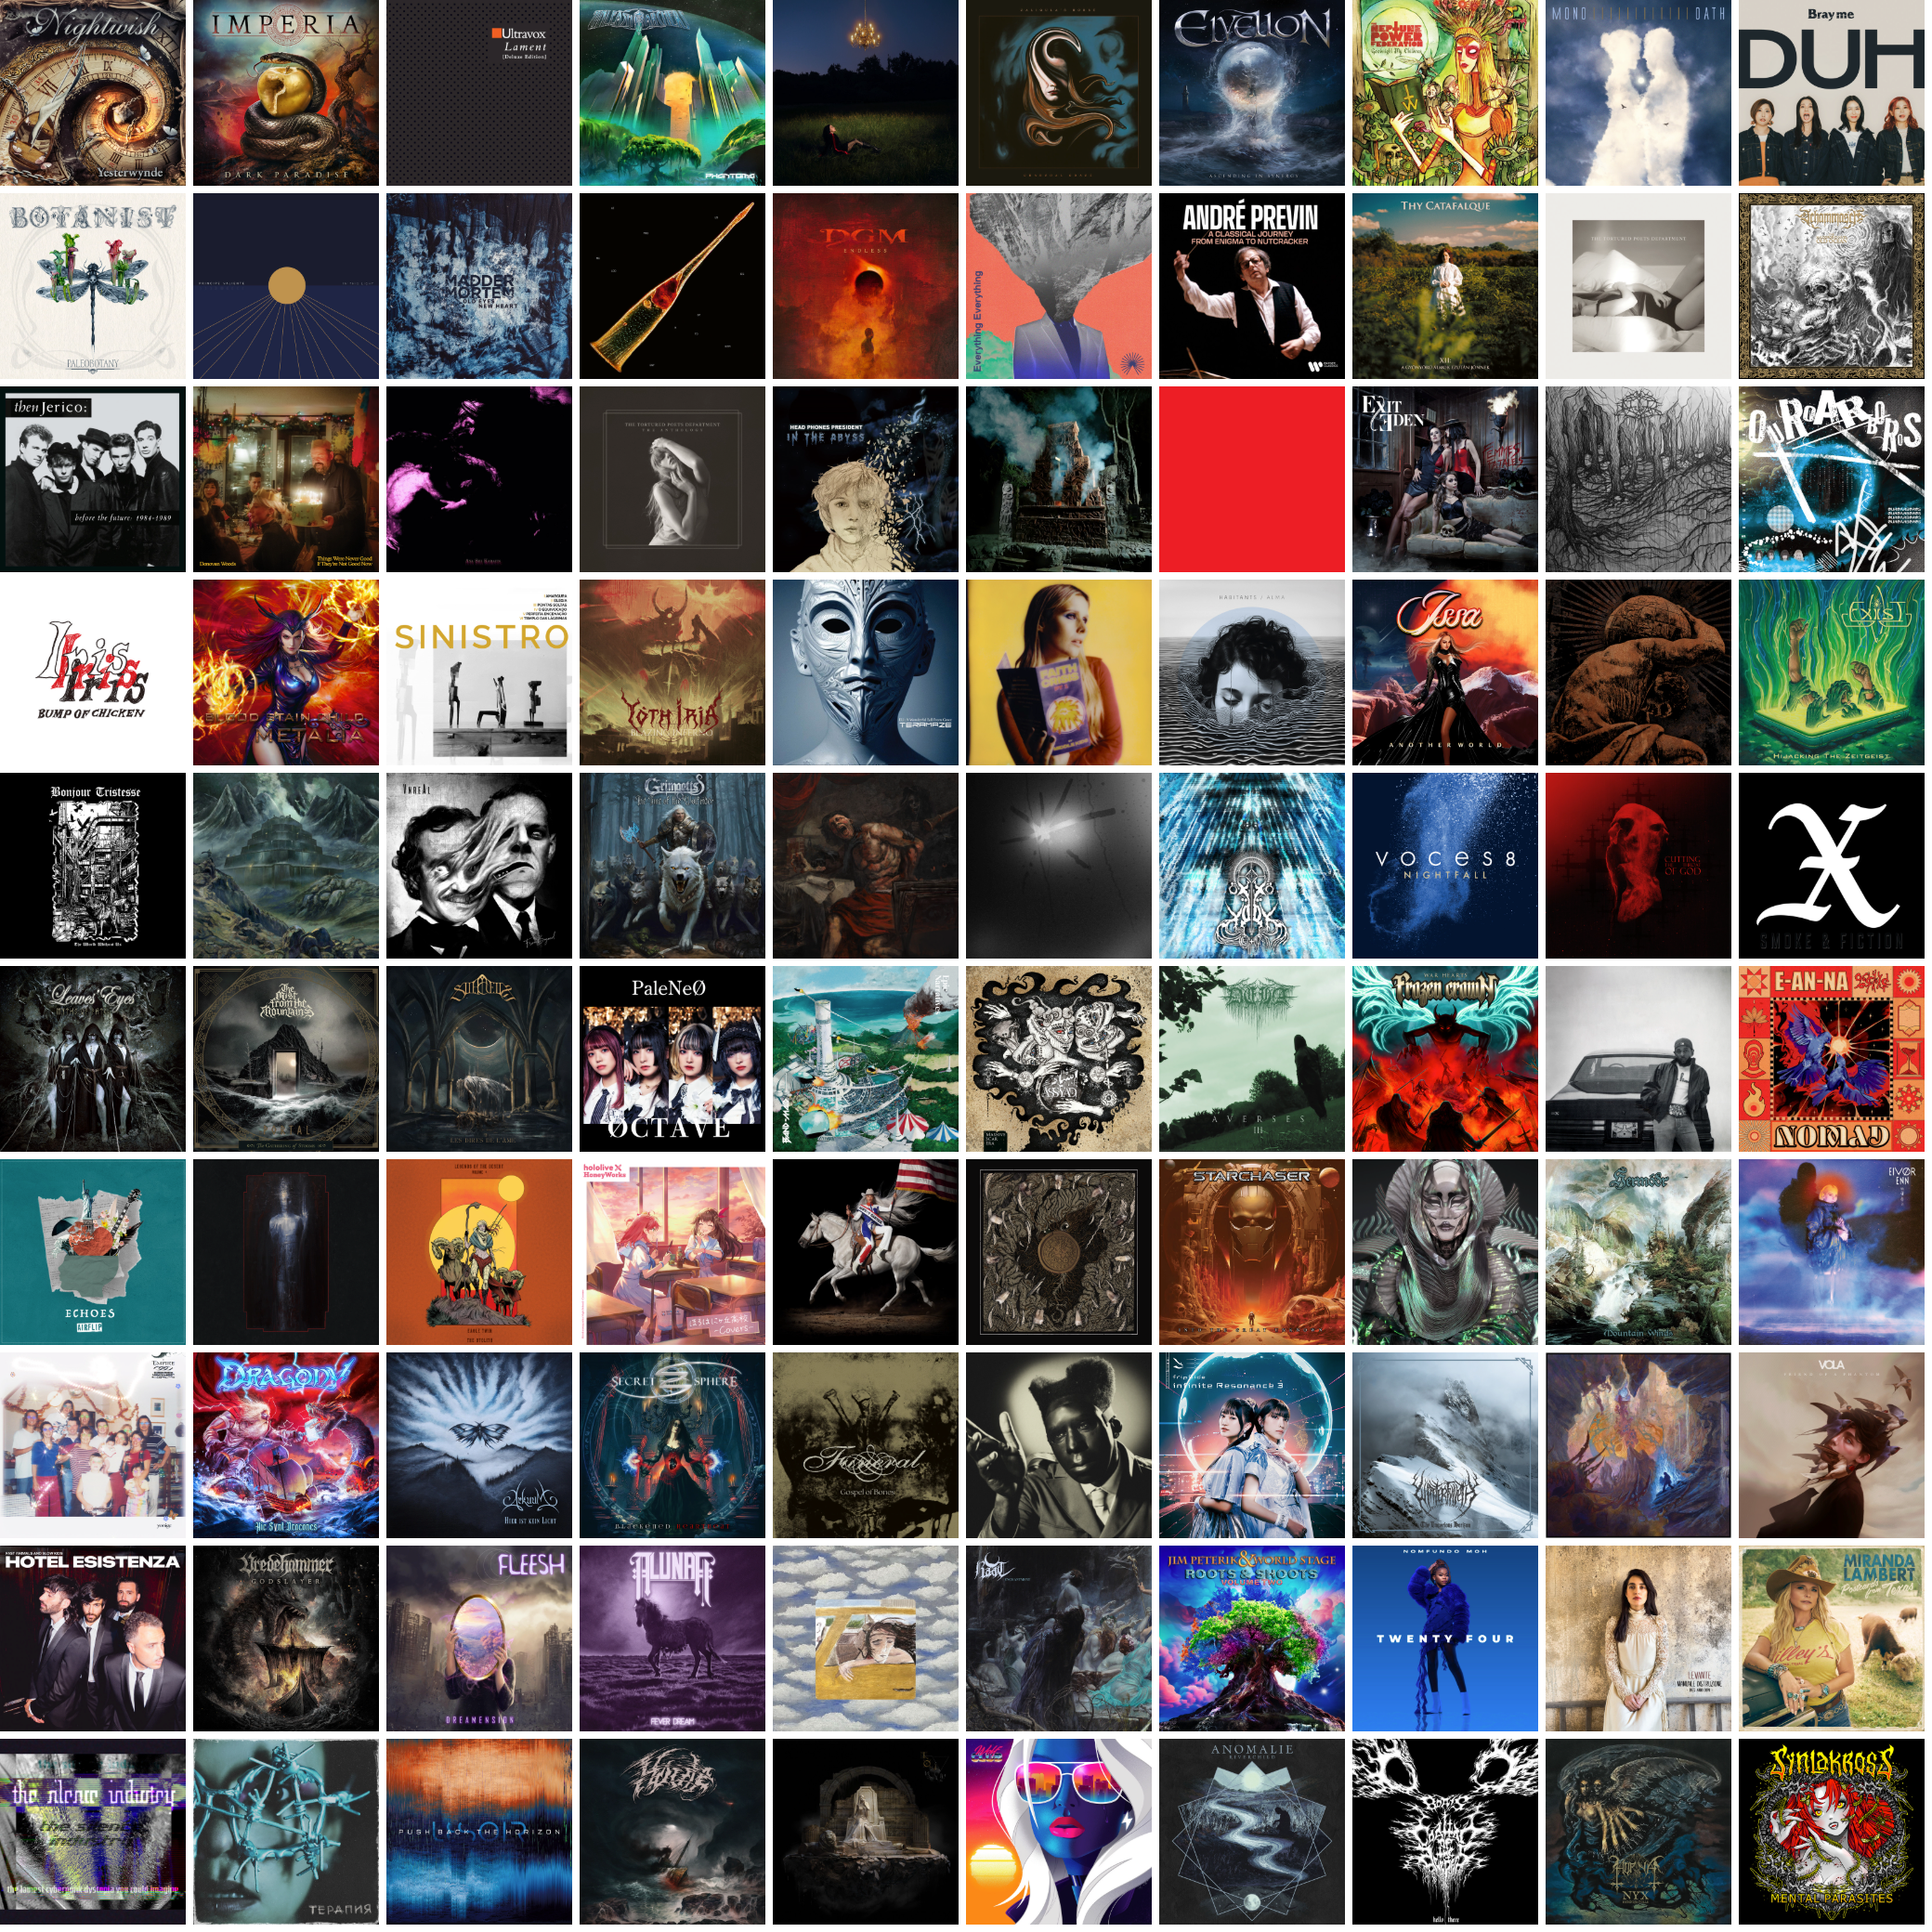
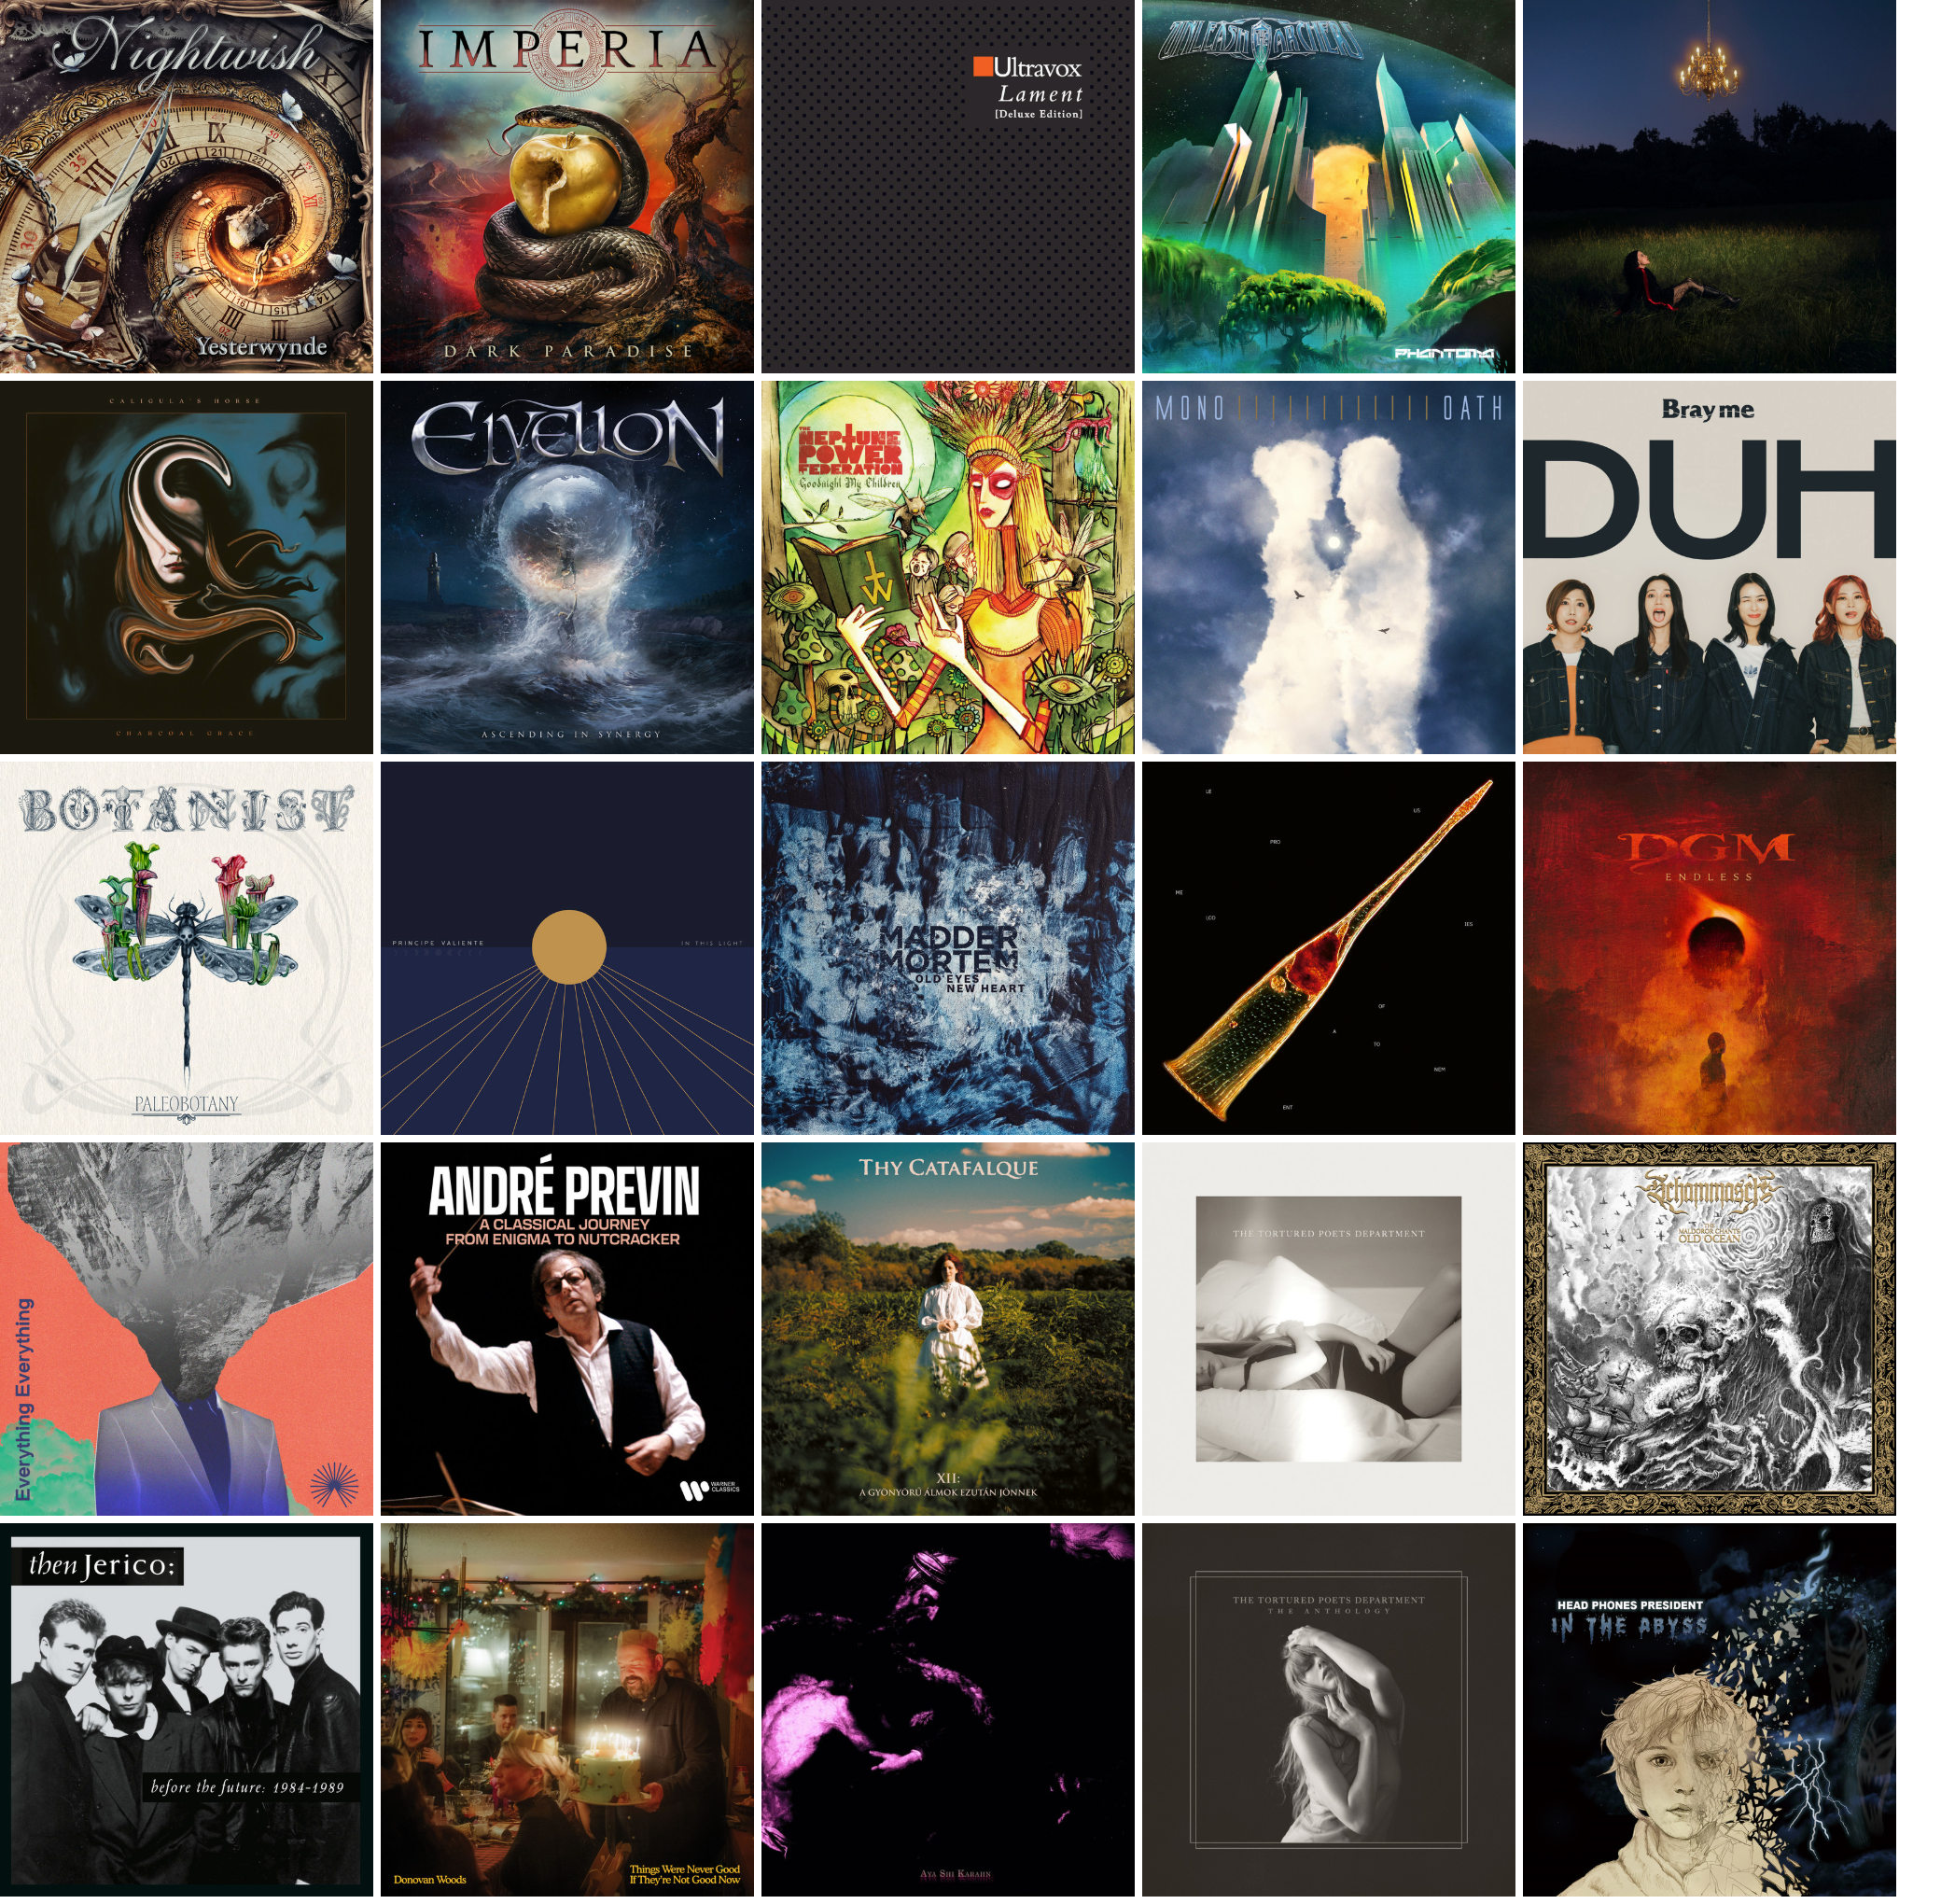
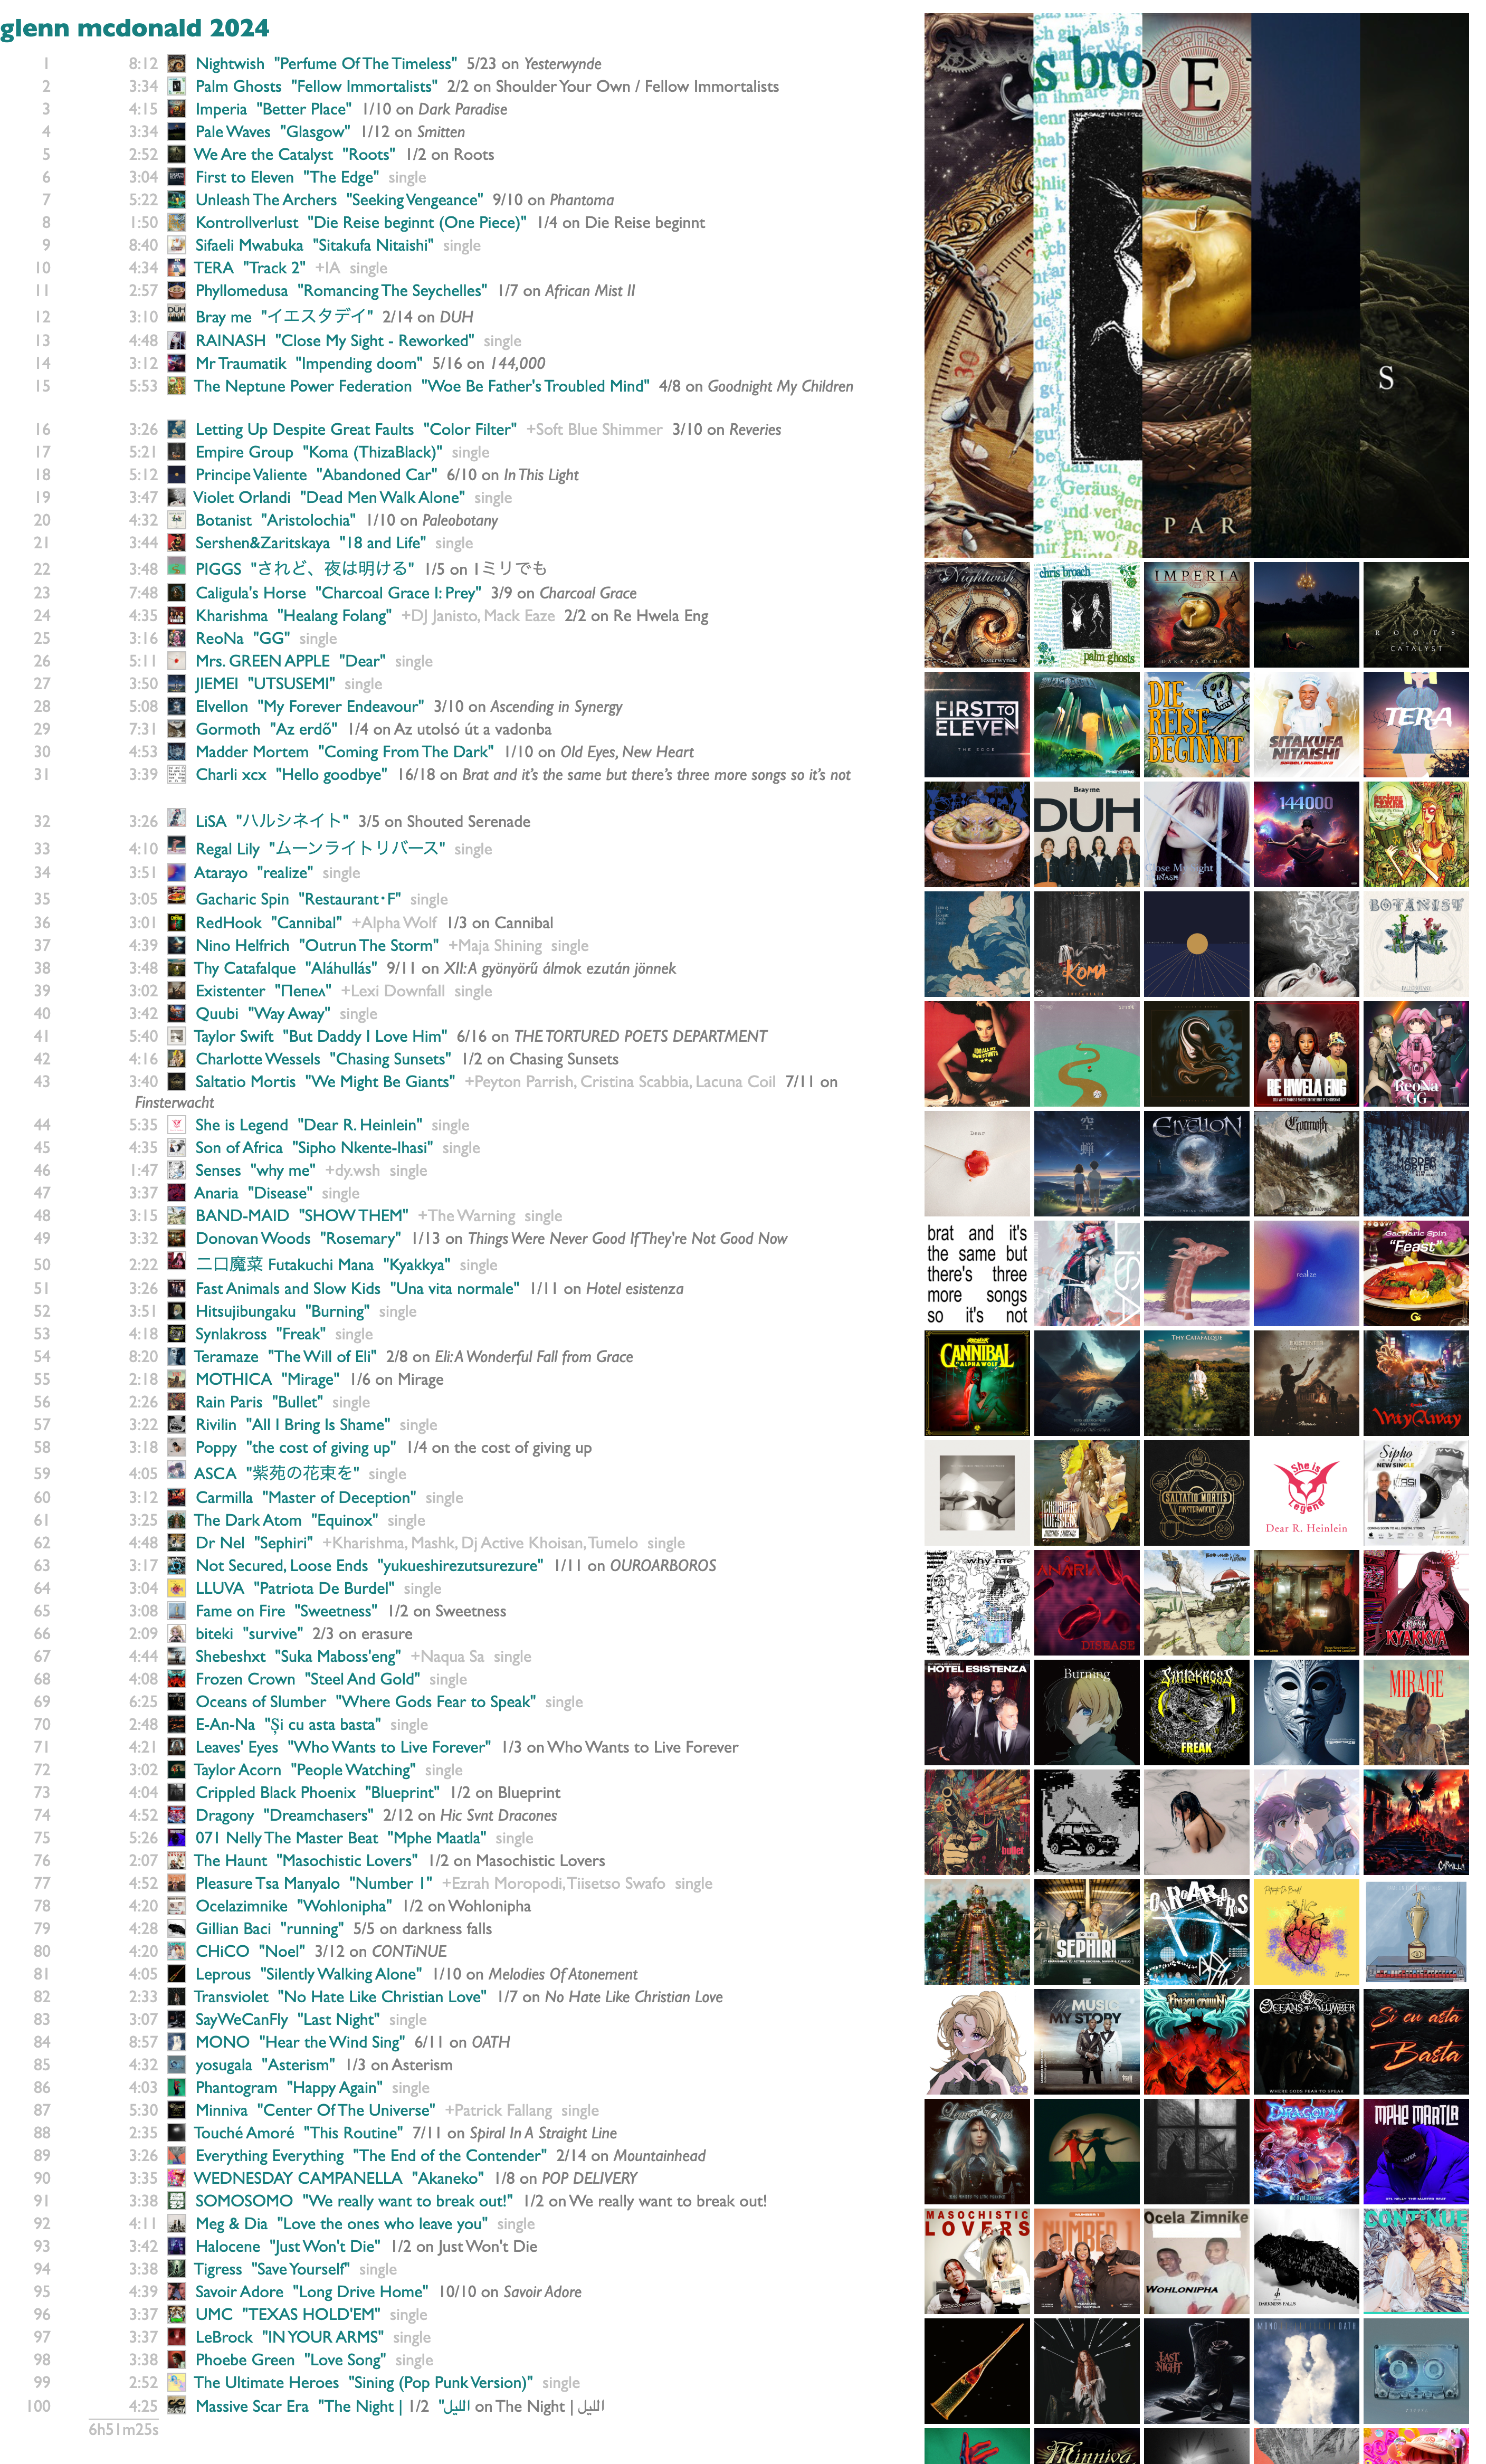
If I want a visual summary of my year in music, it should definitely be made out of the visual art that is already attached to the music, not something else.
playlist
open this playlist in Spotify
The playlist, at least for me, is the authoritative final summary. It's my year in music, so it better be made of music, and it better make sense to me when I play it.
Spotify makes you a playlist, too, called Your Top Songs. It's fine, in that so far they haven't decided to screw it up with any kind of machine learning. It's never what I want, personally, because it ignores release dates and it has mutiple songs per artist and it doesn't sort the way I want.
What I want, and thus built, is not a Top Songs playlist, but an attempt at a playlist that represents a listening year. To do this it starts from the artist list, not song list, and then tries to pick your most-played new song from each of those artists.
Here's what that looks like in Dactal query syntax, as you can see if you click the "see the query for this" link at the bottom of the playlist table, except I've added a little color-coding:
The red parts are the artist query, which goes like this:
- get all your 2024 tracks (from a previous query)
- group these by each track's first artist, song name and date
- assign the square root of the number of times you played that artist/song that day as songdatepoints
- group those artist/song/date groups by artist and song
- total the songdatepoints from all dates per artist/song
- also total the amount of time you played this artist/song
- sort and rank the artist/song groups by songpoints and then songtime (in both cases from larger to smaller)
- group those artist/song groups by artist
- assign each artist a total artistpoints value that is the sum of songpoints-.5 (to reduce the weight of lots of songs you only played once)
- total up the amount of time you listened to that artist
The playlist query inserts one more line (an annotation suboperation) to calculate each artist's topsong for the playlist by taking the artist's highest-ranking artist/song group and getting an album track if one is available from the potentially multiple tracks representing that song, and the one you streamed first otherwise.
The artist query already sorts the artists by artistpoints and then listening time, which is the same order I wanted for the playlist. The :@<=100 picks the first 100, and the final block in parentheses just constructs some nicer columns for the final view. Curio watches for query results with uri columns, and offers to make them into a playlist for you, as you'll see.
The other thing I always wanted in Wrapped and never got, however, is the ability to remove things. Sometimes it's technically true that you played a song a lot, but not emotionally true that you liked it. Or, in my case, it's technically true that the reissue of Ultravox's Lament is a 2024 release, but I don't consider new repackagings of old recordings of "Dancing With Tears in My Eyes" to be new songs, so I prefer to remove that one. The chaining nature of Dactal makes this easy. That final sorting/filtering line just becomes
with the limit filter still at the end so we get 100 tracks instead of 99 despite dropping one. It would also be possible to filter Ultravox out at the artist level, or Lament out at the album level, but it doesn't make any difference to the results.
That's all what Curio gives you, including deleting tracks:

But this still isn't quite what I want, and I am stubborn. I make playlists every week, during the year, and these sometimes represent my decisions, after a week of listening to more than one track from an album, which one to keep. And it's not always the one I played the most times. Curio already has this playlist data, or can have it, if you provide an indexing pattern at the bottom of the Playlists page. This can be as simple as * to index everything, but I have lots of playlists that I made for reasons other than my taste, so I only index these two particular sets:

(End partial matches with asterisks, and separate multiple patterns with a space, so the commas here are part of the matching patterns.)
So my own personal variation adds one more wrinkle to the artist/song-group sorting:
The songkey line computes an artist/song key-string, which the s2pa line then uses to navigate into another dataset, itself produced by a query, that indexes playlist appearances by those same artist/song keys. I could use this dataset join to sort tracks by playlist counts or dates or anything, but all I really want to do is prefer tracks that I put on a playlist to ones I didn't, if there's a choice. So the .(1) part results in a 1 for songkeys that are in the songkey to playlist apperances dataset, and nothing for songkeys that aren't, and Dactal always sorts something before nothing.
There is absolutely no way that you could possibly tell the difference between me doing this and not, nor any reason you should care, but I care. What you choose to care about, in your own data and life, is your business, but the moral function of software is to let us express our care, and thus to encourage us to realize we have it. Your data is yours. The stories it tells are your stories. You should want them to be right, and nobody but you should get to tell you what that right is.
You don't have to care, but I want you to. The more we all care about everything, the less we will tolerate it any of it being bad.
You don't have to want what I want, but if you want to experiment with your Spotify listening data, I've built some tools to help you. To play, you need a computer and a Spotify premium account, and you need to do two things. One is this:
 - go to your Spotify Account page from the popup menu on your profile picture
- scroll down to the evasively named "Account privacy" link and click it
- scroll down the Account privacy page to the "Download your data" section
- check the box on the right under "Extended streaming history", and then the Request Data button at the bottom
While you wait for your data, which will take a couple days, do the other thing, which is to go to Curio, my web thing for collating music-data curiosity, and follow the instructions for getting a free Spotify API key. If you've already done that, just wait impatiently.
When you get your data files from Spotify, go to the History page in Curio and follow the instructions there to load your streaming history. (If the file names in the instructions don't match the files you got, you got the wrong data so go back and request the Extended streaming history like I said.)
You can ask your own questions about your data, but to get started I've already set up a bunch of views that I wanted for myself. Here is a mercilessly geeky tour of those, in which you will learn way more than you ever wanted to know about my year in music.
overview

I listen to music a lot, but never strictly as background, so not for as much time as I could physically. Apparently I went 17 whole days last year without playing any, which I admit is alarming negligence. The count under "tracks" is the strict computer version of counting in which listening to a single and then the exact same song on the album counts as 2 different things. The number under "songs" tries to account for this, although Spotify doesn't give us public access to their internal audio fingerprints, so I just do this by counting unique artist-id/song-title pairs. The "albums" number only counts the albums where I played at least two of their actual tracks (so not separate singles), although it doesn't matter whether they were played from the album page or from playlists. The "artists" number counts only the primary artists of each track. The "genres" number counts only the genres where I listened to stuff by at least 5 different artists. The "of" link at the end tells you that I had 22,423 total streams last year, and you can click your count to see yours, because that's how it should be with data.
tracks

To me a "year in music" is the music that was released in a year. I listen mostly to new music, and all the personal 2024 stats I personally want to see are about my 2024 listening to 2024 music. But there's a "new releases"/"all releases" switcher at the top of most of these History views in Curio, and a separate "old releases" option for a few of them, in case you feel differently. The ranking of tracks is done with a points calculation that you can see for yourself by going to the "see the query for this" link below the table, but my philosophical position is that playing a song on loop for a while is better evidence of affection than playing it once, but not better evidence than returning to it deliberately over the course of different days, so I give each song the sum of 4th roots of its daily playcounts. (Why 4th roots? Square roots didn't mute the looping effect enough for my taste, and chaining two square-roots together worked enough better than I didn't bother adding a cube-root fucntion to the query-language yet. (Although there's also a way to do arbitrary math, so you could raise it to the power of a third, but let's not.)) I don't tend to repeat individual songs very much, so this view isn't my favorite way to look at my own history, but even so it's useful for cross-checking the playlist view that we'll get to at the end.
albums

I mostly listen via weekly playlists of new releases, usually with only one track per artist, and in the increasingly common case of waterfall releases where most of the tracks on an album are released individually before the whole album, it's common that I have listened to most of the contents of an album without directly playing the album much or at all. All of these, though, are cases where I cared enough to break my playlist pattern and play these whole albums. "ms_played" means milliseconds, and is the standard Spotify measurement of how much clock time you spent listening to a song independent of its duration, so if you end up doing your own queries you'll quickly get familiar with this. The query here does some fun stuff with song titles and release types to try to report the album/single dynamics of my listening, but it won't surprise me much if your listening has some edge cases I didn't catch in mine.
artists

But really, my levels of attachment to music are, and have been for years, mostly artist and genre. Humans, individually and collectively. The track and album lists are, for me, steps on the way to this artist list. At the artist level, too, I am leery of overweighting isolated looping, so my artist point system sums up the square roots of the number of unique tracks by that artist played on each listening day. The "count" column here is the total number of unique new 2024 songs I played by each artist. This list is a pretty good telling of my 2024 music story to myself. I expect the chance is low that anybody other than me knows this specific combination of specific artists well enough to make sense of it. First to Eleven is a prolific pop-punk covers band who put out new songs every week or two. TERA is a strange home-demo-sounding vocaloid project that has survived me mostly rotating out of vocaloid music because their use of artificial voices is so artificial. Phyllomedusa is frog-themed grindcore. Sifaeli Mwabuka is a Swahili gospel singer from Tanzania, and I could not have told you his name and am probably as surprised as you that I spent more than four hours listening to him, but apparently he is what happens when you try to listen to both maskandi and Sepedi wedding music despite not really knowing much about either. But mainly what this tells you, as you already knew if you read my book or ever talked to me about music for longer than five minutes, is that I love Nightwish and they had a new album this year.
popularity

My favorite one-time thing I ever did for Spotify Wrapped was the Listening Personality, in 2022. It wasn't supposed to be a one-time virality-nudge, it was supposed to be the seed of a way for humans and algorithms to talk to each other about the aspects of music-preference that are independent of what kind of music you like. Spotify, sadly, was not as interested as I was in what people actually want, nor about using algorithms to amplify curiosity instead of, say, maximizing marginal revenue, so I never got to do more with the Listening Personality codes beyond showing them to people once, but at least I obstinately insisted on Wrapped displaying the four-letter Myers-Briggs-esque codes I devised for each listener, over the graphics team's predictable attempt to reduce the 16 combinations to unexplained tarot cards. (But don't worry, they got their tarot cards the next year.)
I can't exactly reproduce the Listening Personality with just our own listening histories, because the calibration of the polarities of each axis was done holistically across the whole Spotify population. But if we lose collective breadth, we gain individual depth. Instead of a single letter-pair encoding a single score representing how popular the music you tend to listen to tends to be, here we have a heatmap in which the X-axis is your level of artist attachment (scaled to 100 for your most-played artist) and the Y-axis is those artists' global popularities (scaled to 100 for Taylor). What my heatmap tells us is that I listen very broadly to a lot of artists who are not very popular but usually are also not entirely unknown. And I also do like Taylor. If you only listen to Taylor, your heatmap will be a single red cell in the top left with a number of which I assume you will be very proud.
diversity

Two of the other three dimensions of the Listening Personality had to do with how your listening is distributed or concentrated across artists and across songs. I am a fairly extreme outlier in the direction of variety in both, which we see here as a small explosion centered in the bottom (more artists) right (more songs). If you spent the year cycling through Taylor's Versions of everything, you would end up in the top left; if just covers of "Anti-Hero", a red line down the right edge. The axes here are not normalized, because I no longer have access to everybody else's data to figure out a generalized granularity, so your own version of this view may be comically small or awkwardly large.
genres

The Wrapped story I worked on every year (although one year they substituted something else without having the guts to tell me they were going to) was the list of your Top Genres. I have taken some shit over the years for occasionally making up genre names, but if you want to know what the point of that was, there's a whole chapter about it in my book, and after seeing the 2024 Wrapped in which Spotify ditched the whole concept of genres as human musical community and generated idiotic random phrases instead, I feel 100% comfortable with what I did. Every year as we started making plans for Wrapped I said the same three things: 1) I will do the genre analysis so it's right, because these are real communities of artists and listeners in the real world and they deserve to see themselves. 2) Let's show people all their genres instead of just five. 3) And let's also let people see which artists (both in general and that you like) go with each genre, so the whole thing isn't mysterious. And every year the "creative" team said something like "Or what if we show the same unexplained list of five, but as a spinning hamburger made of radioactive sludge?"
Curio's version is obdurately sparkleless but sludgeless: all your genres, ranked with artisanally hand-tuned scoring, and clickable in your version to see exactly which of your artists make up each list.
words

My favorite story I proposed for Wrapped, knowing full-well that it would never get approved, ironically did involve generating random phrases for people, but the way I did it was from the words in the titles of the songs you played, so even this totally frivolous thing was explainable and there was a sense in which it could be correct. The key to getting a short list of pertinent words is having the whole population's listening to work with, so you can give each person the few words that most distinctively characterize their listening. Without that global data I am forced to give you lots of words instead of a few, in a weighted shuffle to avoid everybody's saying love death soundtrack day, but hopefully yours, like mine, will including something true and vulgar that will make you smile and would make lawyers panic.
durations

People talk about pop songs and attention spans both getting shorter, and we have all those milliseconds, so this one is a view of your listening (by month, for fun, across the top) distributed by how long you listened to each track (in minutes, down the left). I listen to a lot of three-minute songs. I listen to a few seconds of a lot of songs and then skip. I listen to some long songs. Apparently in October I was working on getting the track-scan timings right in Curio.
daymap
Everything you play on a streaming service is timestamped. In Spotify's case the timestamps are in UTC, so I included a timeshift option to allow you to bump them into your local time, or adjust your listening day some other way if you prefer. I'm not going to include my daymap, here, because it shows you every timestamp from the entire year and I realize looking at it that immediately reveals exactly when I traveled to a different time zone this year, and maybe that's more sharing than I need.
weekmap

Musically speaking, though, the view by hour and weekday is more relevant. Spotify spent a lot of energy, over the years, trying to believe that most people's listening is heavily determined by day and time, and if yours is, now you have a playlist feature for that in Spotify. Mine isn't. I make a playlist of new songs I want to hear every Friday, and then I cycle through it, gradually deleting songs I don't end up enjoying, for the rest of the week. Thus there is absolutely no sense in which a have different music I prefer on Tuesday afternoon vs Thursday morning. What I do have, as you see here, is a very distinct pattern of doing a lot of rapid new-song scanning while eating my lunch on Fridays. Also, hopefully I do not have any important online accounts for which the security question is "At what hour are you most likely to be asleep?"
release years

The fourth dimension in the Listening Personality was newness. I know, from data, that I am, or at least for a few years provably was, one of the handful of people in the world whose listening is most intently focused on new music. Curio thus has two different ways of looking at this particular quirk. This first one shows release years by listening months, so you can see how I listen to songs from the previous year for at least the first week of January, and how in May last year I tried and ultimately failed to find or remember one particular Ray Charles song.
song ages

My listening pattern is even clearer in this view by song age, with ascending resolution. Friday is new-release day, but I am often distracted from listening over the weekends, so Monday through Thursday I am most heavily playing the songs from the previous Friday.
poster

As you may already realize, my taste in visual design runs to the Tuftean. Don't make me justify the horizonal rule in this poster view to ET, but the order and sizes and colors here are all data-driven, and yet it's still faintly reminiscent of a concert-poster design.
10x10 grid

5x5 grid

banner

If I want a visual summary of my year in music, it should definitely be made out of the visual art that is already attached to the music, not something else.
playlist

open this playlist in Spotify
The playlist, at least for me, is the authoritative final summary. It's my year in music, so it better be made of music, and it better make sense to me when I play it.
Spotify makes you a playlist, too, called Your Top Songs. It's fine, in that so far they haven't decided to screw it up with any kind of machine learning. It's never what I want, personally, because it ignores release dates and it has mutiple songs per artist and it doesn't sort the way I want.
What I want, and thus built, is not a Top Songs playlist, but an attempt at a playlist that represents a listening year. To do this it starts from the artist list, not song list, and then tries to pick your most-played new song from each of those artists.
Here's what that looks like in Dactal query syntax, as you can see if you click the "see the query for this" link at the bottom of the playlist table, except I've added a little color-coding:
2024 tracks full
/artist=(.track info.artists:@1),song=(.track info.name),date
|songdatepoints=(....count,sqrt)
/artist,song
||songpoints=(..of...songdatepoints,total),
songtime=(..of..of....ms_played,total)
#rank=songpoints,songtime
/artist
|artistpoints=(.of..songpoints..(...._,(0.5),difference)....total),
ms_played=(..of..songtime,total),
topsong=(.of:@1.of#(.of.track info.album:album_type=album),(.of.ts):@1.of.track info)
#artistpoints,ms_played:@<=100
.(...artistpoints=artistpoints,
duration=(.topsong....duration_ms,mmss),
artist=(.topsong.artists:@1.name),
track=(.topsong.name),
uri=(.topsong.uri))
The red parts are the artist query, which goes like this:
- get all your 2024 tracks (from a previous query)
- group these by each track's first artist, song name and date
- assign the square root of the number of times you played that artist/song that day as songdatepoints
- group those artist/song/date groups by artist and song
- total the songdatepoints from all dates per artist/song
- also total the amount of time you played this artist/song
- sort and rank the artist/song groups by songpoints and then songtime (in both cases from larger to smaller)
- group those artist/song groups by artist
- assign each artist a total artistpoints value that is the sum of songpoints-.5 (to reduce the weight of lots of songs you only played once)
- total up the amount of time you listened to that artist
The playlist query inserts one more line (an annotation suboperation) to calculate each artist's topsong for the playlist by taking the artist's highest-ranking artist/song group and getting an album track if one is available from the potentially multiple tracks representing that song, and the one you streamed first otherwise.
The artist query already sorts the artists by artistpoints and then listening time, which is the same order I wanted for the playlist. The :@<=100 picks the first 100, and the final block in parentheses just constructs some nicer columns for the final view. Curio watches for query results with uri columns, and offers to make them into a playlist for you, as you'll see.
The other thing I always wanted in Wrapped and never got, however, is the ability to remove things. Sometimes it's technically true that you played a song a lot, but not emotionally true that you liked it. Or, in my case, it's technically true that the reissue of Ultravox's Lament is a 2024 release, but I don't consider new repackagings of old recordings of "Dancing With Tears in My Eyes" to be new songs, so I prefer to remove that one. The chaining nature of Dactal makes this easy. That final sorting/filtering line just becomes
#artistpoints,ms_played:uri-=[spotify:track:3sJYcbQ3CQCpCajduB9UK2]:@<=100
with the limit filter still at the end so we get 100 tracks instead of 99 despite dropping one. It would also be possible to filter Ultravox out at the artist level, or Lament out at the album level, but it doesn't make any difference to the results.
That's all what Curio gives you, including deleting tracks:

But this still isn't quite what I want, and I am stubborn. I make playlists every week, during the year, and these sometimes represent my decisions, after a week of listening to more than one track from an album, which one to keep. And it's not always the one I played the most times. Curio already has this playlist data, or can have it, if you provide an indexing pattern at the bottom of the Playlists page. This can be as simple as * to index everything, but I have lots of playlists that I made for reasons other than my taste, so I only index these two particular sets:

(End partial matches with asterisks, and separate multiple patterns with a space, so the commas here are part of the matching patterns.)
So my own personal variation adds one more wrinkle to the artist/song-group sorting:
/artist,song<
||songpoints=(..of...songdatepoints,total),
songtime=(..of..of....ms_played,total),
songkey=(....(.artist.id),song,concatenate),
s2pa=(.songkey.songkey to playlist appearances.(1))
#rank=s2pa,songpoints,songtime
||songpoints=(..of...songdatepoints,total),
songtime=(..of..of....ms_played,total),
songkey=(....(.artist.id),song,concatenate),
s2pa=(.songkey.songkey to playlist appearances.(1))
#rank=s2pa,songpoints,songtime
The songkey line computes an artist/song key-string, which the s2pa line then uses to navigate into another dataset, itself produced by a query, that indexes playlist appearances by those same artist/song keys. I could use this dataset join to sort tracks by playlist counts or dates or anything, but all I really want to do is prefer tracks that I put on a playlist to ones I didn't, if there's a choice. So the .(1) part results in a 1 for songkeys that are in the songkey to playlist apperances dataset, and nothing for songkeys that aren't, and Dactal always sorts something before nothing.
There is absolutely no way that you could possibly tell the difference between me doing this and not, nor any reason you should care, but I care. What you choose to care about, in your own data and life, is your business, but the moral function of software is to let us express our care, and thus to encourage us to realize we have it. Your data is yours. The stories it tells are your stories. You should want them to be right, and nobody but you should get to tell you what that right is.
You don't have to care, but I want you to. The more we all care about everything, the less we will tolerate it any of it being bad.
